OPEN-SOURCE SCRIPT
Price equilibrium between buyers and sellers [Soroush Rezaei]
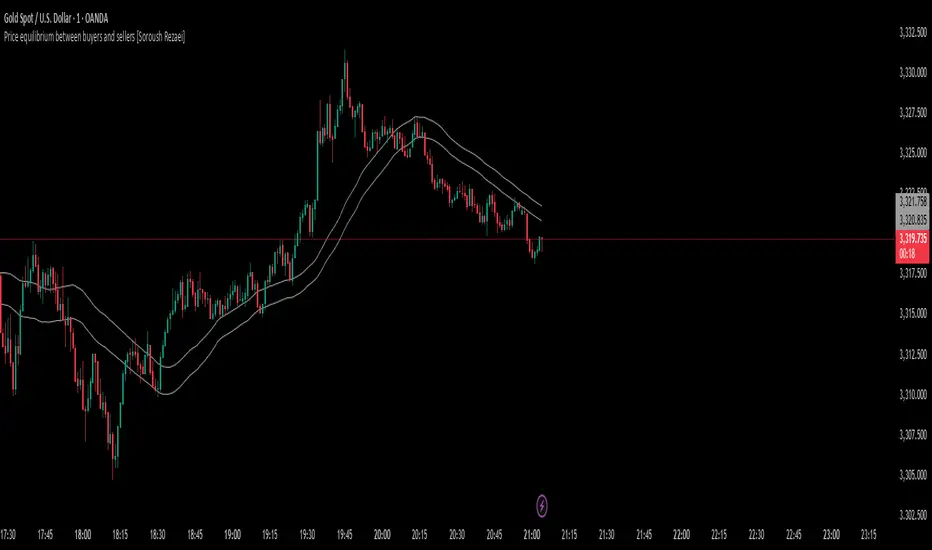
This indicator visualizes the dynamic balance between buyers and sellers using two simple moving averages (SMAs) based on the high and low prices.
The green line (SMA of highs) reflects the upper pressure zone, while the red line (SMA of lows) represents the lower support zone.
When price hovers between these two levels, it often signals a state of temporary equilibrium — a consolidation zone where buyers and sellers are relatively balanced.
Use this tool to:
Recommended for intraday and swing traders seeking visual clarity on market structure and momentum zones.
The green line (SMA of highs) reflects the upper pressure zone, while the red line (SMA of lows) represents the lower support zone.
When price hovers between these two levels, it often signals a state of temporary equilibrium — a consolidation zone where buyers and sellers are relatively balanced.
Use this tool to:
- Identify ranging or balanced market phases
- Spot potential breakout or reversal zones
- Enhance your multi-timeframe or price action strategy
Recommended for intraday and swing traders seeking visual clarity on market structure and momentum zones.
نص برمجي مفتوح المصدر
بروح TradingView الحقيقية، قام مبتكر هذا النص البرمجي بجعله مفتوح المصدر، بحيث يمكن للمتداولين مراجعة وظائفه والتحقق منها. شكرا للمؤلف! بينما يمكنك استخدامه مجانًا، تذكر أن إعادة نشر الكود يخضع لقواعد الموقع الخاصة بنا.
إخلاء المسؤولية
The information and publications are not meant to be, and do not constitute, financial, investment, trading, or other types of advice or recommendations supplied or endorsed by TradingView. Read more in the Terms of Use.