PROTECTED SOURCE SCRIPT
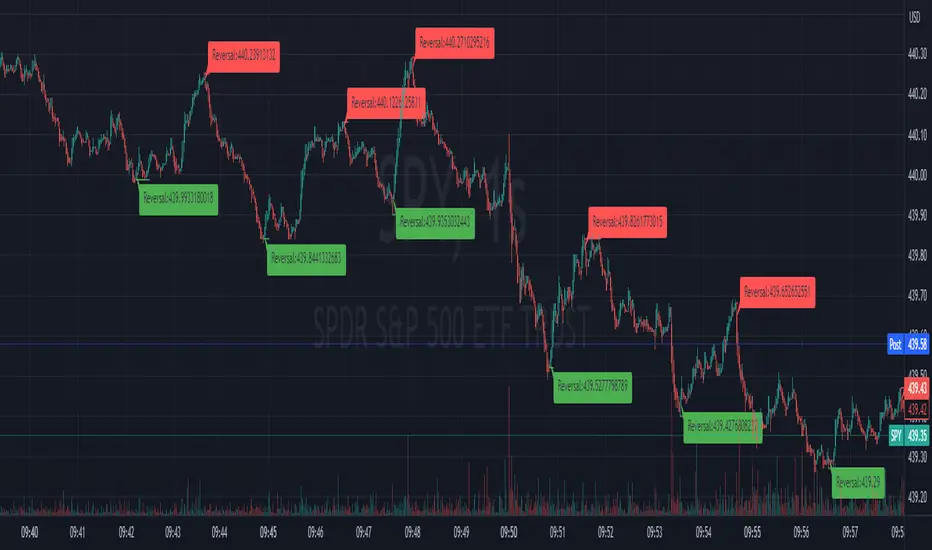
Akamai Reversal (Repaint's)

The indicator is called "Akamai Reversal (Repaint's)" and is designed to be overlaid on the price chart. It uses three exponential moving averages (EMAs) with lengths of 9, 14, and 21 respectively, referred to as Superfast, Fast, and Slow. The indicator generates buy signals when the Superfast EMA is above the Fast EMA, the Fast EMA is above the Slow EMA, and the lowest price in the previous bar is above the Superfast EMA. It generates sell signals when the Superfast EMA is below the Fast EMA, the Fast EMA is below the Slow EMA, and the highest price in the previous bar is below the Superfast EMA. The indicator calculates and tracks bullish and bearish momentum based on the buy and sell signals. It uses a ZigZag indicator to identify price reversals based on either a percentage or absolute amount specified by the user. The indicator calculates the Average True Range (ATR) and uses it to determine the reversal amount. It tracks the state of the price trend (uptrend or downtrend) and identifies high and low points in the trend. The indicator includes options to display bubbles with information such as price changes, price levels, and bar counts associated with trend changes.
نص برمجي محمي
تم نشر هذا النص البرمجي كمصدر مغلق. ومع ذلك، يمكنك استخدامه بحرية ودون أي قيود - تعرف على المزيد هنا.
إخلاء المسؤولية
لا يُقصد بالمعلومات والمنشورات أن تكون، أو تشكل، أي نصيحة مالية أو استثمارية أو تجارية أو أنواع أخرى من النصائح أو التوصيات المقدمة أو المعتمدة من TradingView. اقرأ المزيد في شروط الاستخدام.