ATR Threshold Measure
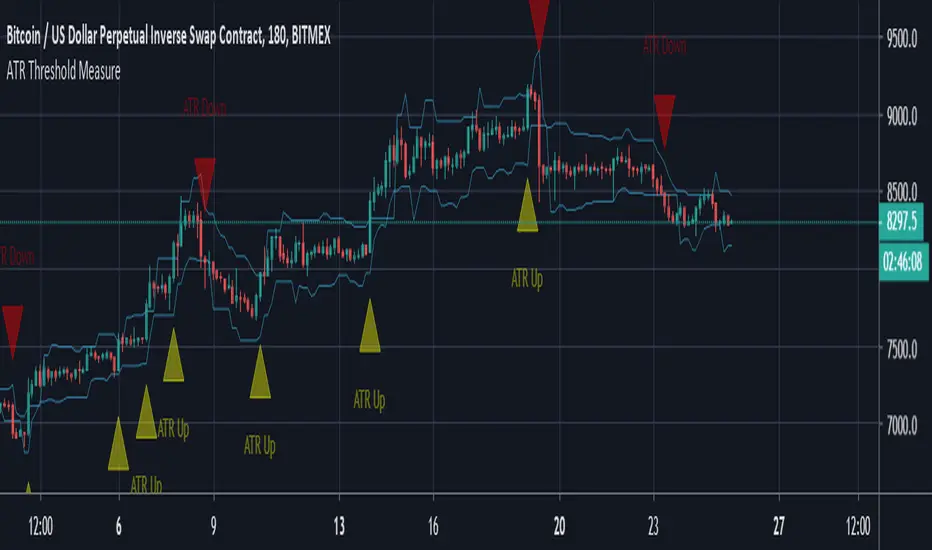
Each plot for upper and lower threshold is based on the difference in price between the open and close of the last consecutive candle sequence then divided by the number of ATRs set by the indicator to verify if price has indeed closed above or below it. Setting alerts to bar candle close only will prevent false alerts mid candles.
A quick bearish example of this would be if you had 4 consecutive red candles. The indicator will take the open of the first candle of the sequence and subtract the current close value from the current candle. It will then take that difference and determine how many ATRs price has moved based on the ATR of the original candle in the sequence(Not the current ATR). If the close of the current candle exceeds the threshold set in the settings an alert is given to notify the user of an increase of volatility in the market in the opposite direction of trend or continuation of trend in a high volatility manner.
نص برمجي للمستخدمين المدعوين فقط
يمكن فقط للمستخدمين الذين تمت الموافقة عليهم من قبل المؤلف الوصول إلى هذا البرنامج النصي. ستحتاج إلى طلب الإذن والحصول عليه لاستخدامه. يتم منح هذا عادةً بعد الدفع. لمزيد من التفاصيل، اتبع تعليمات المؤلف أدناه أو اتصل ب XenoAwake مباشرة.
لا توصي TradingView بالدفع مقابل برنامج نصي أو استخدامه إلا إذا كنت تثق تمامًا في مؤلفه وتفهم كيفية عمله. يمكنك أيضًا العثور على بدائل مجانية ومفتوحة المصدر في نصوص مجتمعنا.
تعليمات المؤلف
إخلاء المسؤولية
نص برمجي للمستخدمين المدعوين فقط
يمكن فقط للمستخدمين الذين تمت الموافقة عليهم من قبل المؤلف الوصول إلى هذا البرنامج النصي. ستحتاج إلى طلب الإذن والحصول عليه لاستخدامه. يتم منح هذا عادةً بعد الدفع. لمزيد من التفاصيل، اتبع تعليمات المؤلف أدناه أو اتصل ب XenoAwake مباشرة.
لا توصي TradingView بالدفع مقابل برنامج نصي أو استخدامه إلا إذا كنت تثق تمامًا في مؤلفه وتفهم كيفية عمله. يمكنك أيضًا العثور على بدائل مجانية ومفتوحة المصدر في نصوص مجتمعنا.