PROTECTED SOURCE SCRIPT
تم تحديثه Support and Resistance Levels
Support and Resistance Levels Indicator
Introducing an indicator that helps automatically identify key support and resistance levels. It analyzes historical data to detect price pivot points and draws horizontal lines based on them. This simplifies chart analysis and allows you to focus on important zones.
How the Indicator Works
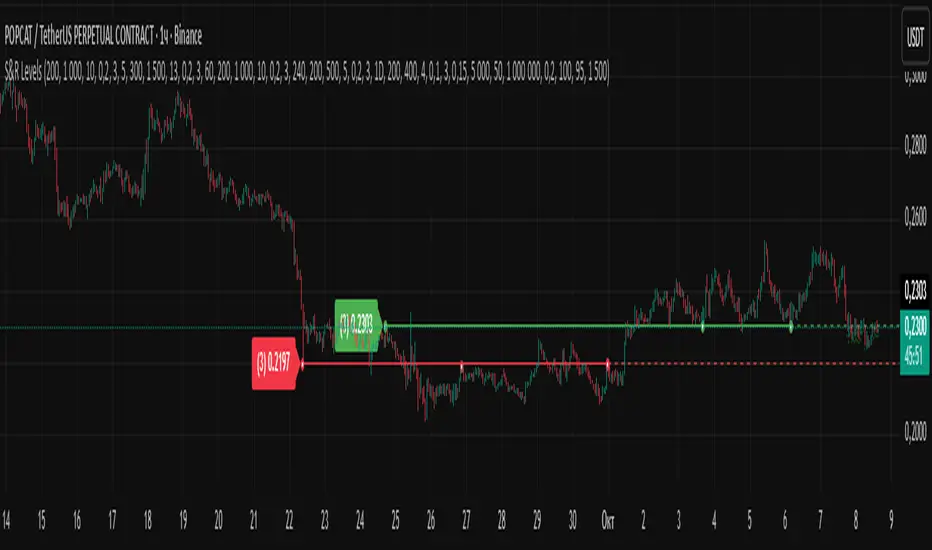
The indicator searches for groups of pivot points (minimum three by default) that lie at the same price level within a specified tolerance (in ATR). If the price has bounced off this level three or more times—up or down—the indicator draws a line. The line displays all the points that formed it (small markers "•").
The line color depends on the type of the last point: green for support (lower pivots) and red for resistance (upper pivots). But remember, this is conditional—any level can act as support or resistance depending on the context. The key is that these are zones of interest where price often reacts.
Features
The indicator excels at finding strong levels, but on lower timeframes or during prolonged consolidation (sideways movement) due to market noise, it may draw many lines. To avoid accidentally removing useful levels, I didn't add automatic filtering. In such cases, just evaluate the levels manually—look at the context and the strength of the touches.
Main Feature: Alerts for Premium Subscription
If you have TradingView Premium, the indicator turns into a powerful scanner. Set up an alert for a list of hundreds of instruments: when the price on any of them approaches a level closely (by default within 0.15 ATR), you'll get a push notification. Add filters for trading volume (over 5 minutes or 24 hours) and volatility—and false signals are minimized.
For example, you have a list of 100 instruments. Set up the alert—and you'll immediately receive notifications for all where the price is already close to a level: "BTCUSD on 1h: price near resistance level 60,000", "ETHUSD on 4h: price near support 3,000", and so on. And if later the price on any other instrument from the list approaches a level—you'll get a new message with details. All that's left is to open the relevant chart, assess the situation, and decide: enter the trade or skip it. This saves hours of monitoring!
Индикатор уровней поддержки и сопротивления
Представляю индикатор, который помогает автоматически находить ключевые уровни поддержки и сопротивления. Он анализирует исторические данные, выявляя точки разворота цены, и строит на их основе горизонтальные линии. Это упрощает анализ графика и позволяет фокусироваться на важных зонах.
Как работает индикатор
Индикатор ищет группы точек разворота (по умолчанию минимум три), которые лежат на одной ценовой отметке в пределах заданной погрешности (в ATR). Если цена трижды (или больше) отскакивала от этого уровня — вверх или вниз, — индикатор рисует линию. На линии отображаются все точки, которые её сформировали (маленькие метки "•").
Цвет линии зависит от типа последней точки: зелёный для поддержки (нижние развороты) и красный для сопротивления (верхние). Но помните, это условно — любой уровень может работать как поддержка или сопротивление в зависимости от контекста. Суть в том, что это зоны интереса, где цена часто реагирует.
Особенности
Индикатор хорошо справляется с поиском сильных уровней, но на низких таймфреймах или в длительной консолидации (боковике) из-за рыночного шума может появиться много линий. Чтобы не рисковать удалением полезных уровней, я не добавил автоматическую фильтрацию. В таких случаях просто оценивайте уровни вручную — смотрите на контекст и силу касаний.
Главная фишка: Алерты для Premium-подписки
Если у вас TradingView Premium, индикатор превращается в мощный сканер. Создайте алерт на список из сотен инструментов: когда цена на любом из них подойдёт близко к уровню (по умолчанию в пределах 0.15 ATR), вы получите push-уведомление. Добавьте фильтры по объёму торгов (за 5 минут или 24 часа) и волатильности — и ложные сигналы минимизированы.
Например, у вас список из 100 инструментов. Настройте алерт — и сразу придут уведомления по всем, где цена уже близко к уровню: "BTCUSD на 1ч: цена у уровня сопротивления 60 000", "ETHUSD на 4ч: цена у поддержки 3000" и так далее. А если позже на любом другом инструменте из списка цена приблизится к уровню — придет новое сообщение с деталями. Остаётся только открыть нужный график, оценить ситуацию и решить: входить в сделку или пропустить. Это экономит часы мониторинга!
Introducing an indicator that helps automatically identify key support and resistance levels. It analyzes historical data to detect price pivot points and draws horizontal lines based on them. This simplifies chart analysis and allows you to focus on important zones.
How the Indicator Works
The indicator searches for groups of pivot points (minimum three by default) that lie at the same price level within a specified tolerance (in ATR). If the price has bounced off this level three or more times—up or down—the indicator draws a line. The line displays all the points that formed it (small markers "•").
The line color depends on the type of the last point: green for support (lower pivots) and red for resistance (upper pivots). But remember, this is conditional—any level can act as support or resistance depending on the context. The key is that these are zones of interest where price often reacts.
Features
The indicator excels at finding strong levels, but on lower timeframes or during prolonged consolidation (sideways movement) due to market noise, it may draw many lines. To avoid accidentally removing useful levels, I didn't add automatic filtering. In such cases, just evaluate the levels manually—look at the context and the strength of the touches.
Main Feature: Alerts for Premium Subscription
If you have TradingView Premium, the indicator turns into a powerful scanner. Set up an alert for a list of hundreds of instruments: when the price on any of them approaches a level closely (by default within 0.15 ATR), you'll get a push notification. Add filters for trading volume (over 5 minutes or 24 hours) and volatility—and false signals are minimized.
For example, you have a list of 100 instruments. Set up the alert—and you'll immediately receive notifications for all where the price is already close to a level: "BTCUSD on 1h: price near resistance level 60,000", "ETHUSD on 4h: price near support 3,000", and so on. And if later the price on any other instrument from the list approaches a level—you'll get a new message with details. All that's left is to open the relevant chart, assess the situation, and decide: enter the trade or skip it. This saves hours of monitoring!
Индикатор уровней поддержки и сопротивления
Представляю индикатор, который помогает автоматически находить ключевые уровни поддержки и сопротивления. Он анализирует исторические данные, выявляя точки разворота цены, и строит на их основе горизонтальные линии. Это упрощает анализ графика и позволяет фокусироваться на важных зонах.
Как работает индикатор
Индикатор ищет группы точек разворота (по умолчанию минимум три), которые лежат на одной ценовой отметке в пределах заданной погрешности (в ATR). Если цена трижды (или больше) отскакивала от этого уровня — вверх или вниз, — индикатор рисует линию. На линии отображаются все точки, которые её сформировали (маленькие метки "•").
Цвет линии зависит от типа последней точки: зелёный для поддержки (нижние развороты) и красный для сопротивления (верхние). Но помните, это условно — любой уровень может работать как поддержка или сопротивление в зависимости от контекста. Суть в том, что это зоны интереса, где цена часто реагирует.
Особенности
Индикатор хорошо справляется с поиском сильных уровней, но на низких таймфреймах или в длительной консолидации (боковике) из-за рыночного шума может появиться много линий. Чтобы не рисковать удалением полезных уровней, я не добавил автоматическую фильтрацию. В таких случаях просто оценивайте уровни вручную — смотрите на контекст и силу касаний.
Главная фишка: Алерты для Premium-подписки
Если у вас TradingView Premium, индикатор превращается в мощный сканер. Создайте алерт на список из сотен инструментов: когда цена на любом из них подойдёт близко к уровню (по умолчанию в пределах 0.15 ATR), вы получите push-уведомление. Добавьте фильтры по объёму торгов (за 5 минут или 24 часа) и волатильности — и ложные сигналы минимизированы.
Например, у вас список из 100 инструментов. Настройте алерт — и сразу придут уведомления по всем, где цена уже близко к уровню: "BTCUSD на 1ч: цена у уровня сопротивления 60 000", "ETHUSD на 4ч: цена у поддержки 3000" и так далее. А если позже на любом другом инструменте из списка цена приблизится к уровню — придет новое сообщение с деталями. Остаётся только открыть нужный график, оценить ситуацию и решить: входить в сделку или пропустить. Это экономит часы мониторинга!
ملاحظات الأخبار
1.ملاحظات الأخبار
Indicator Menu: Simple Guide to FunctionsGeneral Settings
• Smooth Price: Rounds level prices to the nearest round values for easier reading (may work incorrectly on some instruments; not recommended to enable).
• Use Average Price: Builds the level based on the average price from all pivot points, not the extremes. If disabled, the level will be built based on the oldest (first) point that participates in creating the level.
Level Settings for All Timeframes (General Level Construction Settings)
• Remove Old Levels: Automatically clears the chart of outdated lines.
• Max Bars Without Touch: Removes levels that haven't been touched by price for a long time.
• Bars for Analysis: Determines how far back to search for pivot points.
• Pivot Bars: Sets the number of bars to the left and right for detecting upper and lower pivot points.
• Level Precision: Sets the allowable price deviation for grouping points into one level (in ATR).
• Min. Pivot Points: Specifies the minimum number of touches for a level to be valid. The level is drawn based on at least three touches, but if there are more, the indicator will mark all of them and extend the line. The label to the left of the level will show the number of touches and the price in parentheses. If there are more touches than the minimum, the label will turn purple, emphasizing the level's importance.
Settings for TF1–4 (Settings for Timeframe 1–4) (Presets: TF1=5m, TF2=1h, TF3=4h, TF4=1D)
• Apply for TF: Enables individual parameters for the selected timeframe. This is necessary to avoid chaos when using the same settings on different timeframes. For example, if you configure the search for a 1-hour chart and then enable the same parameters on a 5-minute chart, noise on the lower TF will create extra levels.
• TF Selection: Allows you to specify a specific timeframe for analysis.
• Remove Old Levels: Same as general, but for this TF.
• Max Bars Without Touch: Same as general, but for this TF.
• Bars for Analysis: Same as general, but for this TF.
• Pivot Bars: Same as general, but for this TF.
• Level Precision: Same as general, but for this TF.
• Min. Pivot Points: Same as general, but for this TF.
Alert Settings
• Alert Zone Width: Determines the distance from the level at which the notification triggers (in ATR).
Alert Filters (Filters for Alerts)
• These settings affect only push notifications, not line drawing.
• 5-Min Volume Filter: Requires a minimum trading volume over 5 minutes for the signal.
• Volume Calculation Period (5 min): Sets the period for calculating the average volume.
• 24-Hour Volume Filter: Requires a minimum volume over 24 hours for the signal. That is, if the volume on the instrument is below the set value, the indicator will ignore it and won't send a message.
• Activity Filter: Checks for minimum market volatility to activate. Useful for filtering low-volatility instruments.
• Activity Period: Sets the period for calculating volatility.
• Show Markers: Displays visual alert icons on the chart. These markers help you understand how your filters work: if there's a dot above or below the candle, a message will come; if the criteria are too strict, the dots will disappear.
Additional Settings
• Spread Zone: Shows a semi-transparent area of point spread for better understanding.
• Zone Transparency: Adjusts the visibility of the zone on the chart.
• Last Point of Removed: Marks the point when a level is removed for tracking.
Меню индикатора: простое руководство по функциям
Общие настройки (General Settings)
• Сглаживать цену: Округляет цены уровней до ближайших круглых значений для удобства чтения (на некоторых инструментах работает некорректно, не рекомендую включать).
• Использовать среднюю цену: Строит уровень по средней цене из всех точек разворота, а не по крайним. Если выключить, уровень будет построен по самой старой (первой) точке, которая участвует в создании уровня.
Настройки уровней для всех ТФ (General Level Construction Settings)
• Удалять старые уровни: Автоматически очищает график от устаревших линий.
• Макс. баров без касания: Удаляет уровни, которые давно не касались цены.
• Баров для анализа: Определяет, насколько далеко назад искать точки разворота.
• Бары разворота: Устанавливает количество баров слева и справа для выявления верхних и нижних точек разворота.
• Точность уровня: Задаёт допустимое отклонение цен для группировки точек в один уровень (в ATR).
• Мин. точек разворота: Указывает минимум касаний, чтобы уровень считался валидным. Уровень рисуется минимум по трём касаниям, но если их больше, индикатор отметит все и продолжит линию. На метке слева от уровня в скобках отобразится количество касаний и цена. Если касаний больше минимума, метка станет фиолетовой, подчёркивая важность уровня.
Настройки для ТФ1–4 (Settings for Timeframe 1–4) (Пресеты: ТФ1=5м, ТФ2=1ч, ТФ3=4ч, ТФ4=1Д)
• Применить для ТФ: Включает индивидуальные параметры для выбранного таймфрейма. Это нужно, чтобы избежать хаоса при использовании одних и тех же настроек на разных ТФ. Например, если вы настроили поиск под часовой график, а потом включили те же параметры на 5-минутном, шум на младшем ТФ создаст лишние уровни.
• Выбор ТФ: Позволяет указать конкретный таймфрейм для анализа.
• Удалять старые уровни: Как в общих, но для этого ТФ.
• Макс. баров без касания: Как в общих, но для этого ТФ.
• Баров для анализа: Как в общих, но для этого ТФ.
• Бары разворота: Как в общих, но для этого ТФ.
• Точность уровня: Как в общих, но для этого ТФ.
• Мин. точек разворота: Как в общих, но для этого ТФ.
Настройки алертов (Alert Settings)
• Ширина зоны алерта: Определяет расстояние от уровня, при котором срабатывает уведомление (в ATR).
Фильтры алертов (Filters for Alerts)
• Эти настройки влияют только на push-уведомления, на отрисовку линий — нет.
• Фильтр объёма 5 мин: Требует минимальный объём торгов за 5 минут для сигнала.
• Период для расчёта объёма (5 мин): Устанавливает период для среднего объёма.
• Фильтр объёма 24 ч: Требует минимальный объём за сутки для сигнала. То есть, если объём на инструменте ниже установленного, индикатор игнорирует его и не пришлёт сообщение.
• Фильтр активности: Проверяет минимальную волатильность рынка для активации. Полезно для фильтрации низковолатильных инструментов.
• Период активности: Устанавливает период для расчёта волатильности.
• Показывать маркеры: Отображает визуальные значки алертов на графике. Эти маркеры помогают понять, как работают ваши фильтры: если точка над или под свечой есть, сообщение придёт; если критерии слишком строгие, точки исчезнут.
Доп. настройки (Additional Settings)
• Зона разброса: Показывает полупрозрачную область разброса точек для лучшего понимания.
• Прозрачность зоны: Регулирует видимость зоны на графике.
• Последняя точка удалённого: Отмечает точку при удалении уровня для отслеживания.
نص برمجي محمي
تم نشر هذا النص البرمجي كمصدر مغلق. ومع ذلك، يمكنك استخدامه بحرية ودون أي قيود - تعرف على المزيد هنا.
إخلاء المسؤولية
لا يُقصد بالمعلومات والمنشورات أن تكون، أو تشكل، أي نصيحة مالية أو استثمارية أو تجارية أو أنواع أخرى من النصائح أو التوصيات المقدمة أو المعتمدة من TradingView. اقرأ المزيد في شروط الاستخدام.