OPEN-SOURCE SCRIPT
Moving Avareges Cross
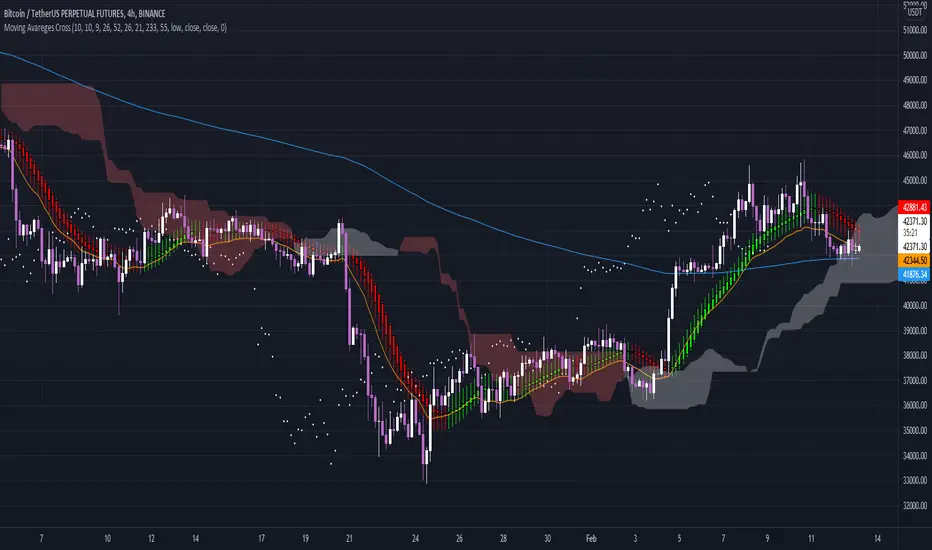
In this script I have combined 3 indicators Ichimoku, Heiken Ashi and Moving Average Exponential.
In this strategy, you should first look for the current market trend in low time frames.
Then look at the higher time frames to decide if you are in the right place to enter the trade.
For example, in 1 minute time frame, we first look at whether the two averages 21 and 233 had a cross or not.
If the moving average of 21 crosses the moving average of 233 from the bottom up and the end of the line moves the moving average of 233 upwards, it can be concluded
The market trend in time frame has changed for 1 minute and is up.
Then we refer to the time frames of 3, 5 and 15 minutes and check the same conditions there.
If 3 of the 4 time frames have the same conditions, we use Heiken Ashi to check the strength of the wave that is formed.
And also by looking at Ichimoku we will see where this Kumo cloud formed this wave.
If these conditions are met, a serious decision can be made to enter the position.
Higher time frames such as 30 minutes or 1 hour and 4 hours can also be used to find important resistance and support pivots.
In this way, the average of 233 and 21 and the formation of the current candlestick give us an acceptable range for fluctuation.
نص برمجي مفتوح المصدر
بروح TradingView الحقيقية، قام مبتكر هذا النص البرمجي بجعله مفتوح المصدر، بحيث يمكن للمتداولين مراجعة وظائفه والتحقق منها. شكرا للمؤلف! بينما يمكنك استخدامه مجانًا، تذكر أن إعادة نشر الكود يخضع لقواعد الموقع الخاصة بنا.
إخلاء المسؤولية
لا يُقصد بالمعلومات والمنشورات أن تكون، أو تشكل، أي نصيحة مالية أو استثمارية أو تجارية أو أنواع أخرى من النصائح أو التوصيات المقدمة أو المعتمدة من TradingView. اقرأ المزيد في شروط الاستخدام.