PROTECTED SOURCE SCRIPT
[TS] Enhanced MACD
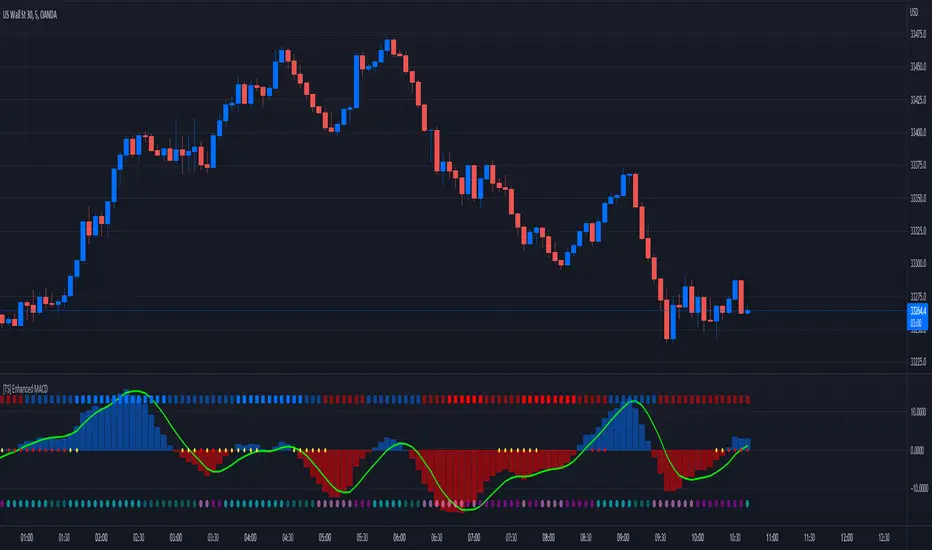
This is an Enhanced version of the standard MACD Indicator.
It displays the MACD Histogram as a normalized oscillator for a better visual representation (With values between -100 to 100)
On the top we have the WaveTrend indicator, showing the general trend of an asset (4 Color codings)
On 0 line, with red and yellow circles, is displayed the Contraption (or so-called Squeeze) of the price action.
When these circles appear a major shift in trend is expected.
On the bottom, we have another set of circles, which measure the price compression - These signal a period of very low price volatility.
نص برمجي محمي
تم نشر هذا النص البرمجي كمصدر مغلق. ومع ذلك، يمكنك استخدامه بحرية ودون أي قيود - تعرف على المزيد هنا.
Trusted Indicators
Visit: TrustedSignals.com or TrustedIndicators.com
Visit: TrustedSignals.com or TrustedIndicators.com
إخلاء المسؤولية
لا يُقصد بالمعلومات والمنشورات أن تكون، أو تشكل، أي نصيحة مالية أو استثمارية أو تجارية أو أنواع أخرى من النصائح أو التوصيات المقدمة أو المعتمدة من TradingView. اقرأ المزيد في شروط الاستخدام.