OPEN-SOURCE SCRIPT
[MAD] Custom Session VWAP Bands
Overview
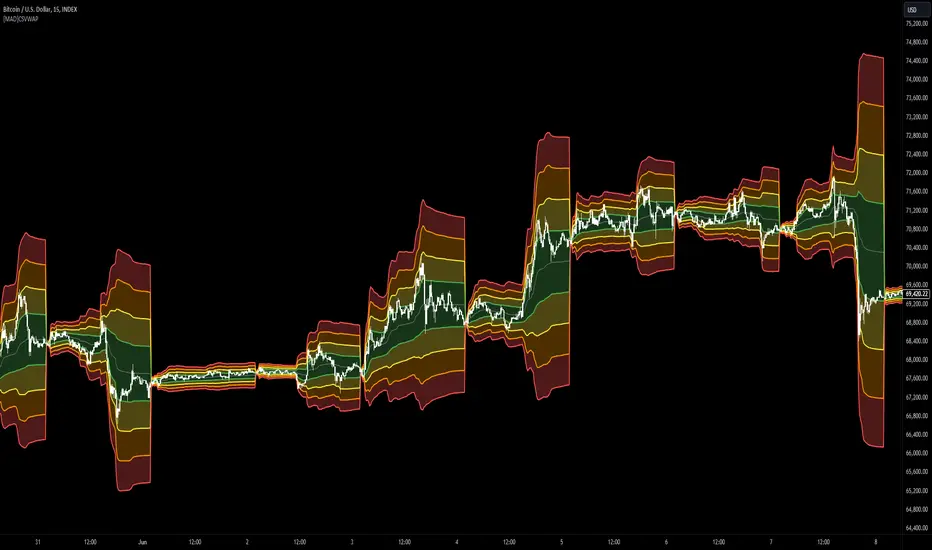
This indicator helps visualize the Volume Weighted Average Price (VWAP) and its associated standard deviation bands over specified time periods, providing traders with a clear understanding of price trends, volatility, and potential support/resistance levels.
Inputs
Deviation
Custom Vwap session reset settings
Many different options are considered when a session is going to be reset.
Plot and Fill Options
How to Use the Indicator
Adding the Indicator
Add the indicator to your chart through your trading platform's indicator menu.
Configuring the VWAP Reset
Specify reset intervals based on time, days of the week, or specific dates.
Adjust the time zone if necessary.
Customizing Standard Deviation Bands
Set the multipliers for the standard deviation bands.
Choose line width for better visualization.
Enabling Plots and Fills
Select which bands to display.
Enable or disable fills between the bands.
Practical Application of VWAP Bands
Understanding VWAP
VWAP is a trading benchmark that calculates the average price a security has traded at throughout the day based on volume and price. It is primarily used for intraday trading but can also offer insights during end-of-day reviews.
Using VWAP for Trading
Intraday Trading
Entry and Exit Points: VWAP can help identify optimal buy and sell points. Buy when the price is above VWAP and sell when it's below.
Support and Resistance: VWAP often acts as a dynamic support/resistance level. Prices tend to revert to VWAP, making it a crucial level for intraday traders.
Trend Confirmation
Uptrends and Downtrends: In an uptrend, the price will generally stay above VWAP. Conversely, in a downtrend, it will stay below. Use this to confirm market direction.
Combining with Other Indicators
Moving Averages and Bollinger Bands: Combining VWAP with these indicators can provide a more robust trading signal, confirming trends and potential reversals.
Setting Stop-Loss and Profit Targets
Conservative Stop Orders: Place stop orders at recent lows for pullback trades.
Profit Targets: Use daily highs or Fibonacci extension levels to set profit targets.
Strategies for Using VWAP
Pullback Strategy
Buy during pullbacks to VWAP in an uptrend, and sell during rallies to VWAP in a downtrend.
Breakout Strategy
Look for breakouts above/below VWAP after the market open to capitalize on new trends.
Momentum Trading
Use VWAP to confirm the strength of a trend. Buy when the price is consistently above VWAP and sell when it's consistently below.
Institutional Strategies
Institutional traders use VWAP to execute large orders without causing significant market impact, ensuring trades are made around the average price.
By incorporating these strategies, traders can better understand market dynamics, make informed trading decisions, and manage their risk effectively.
Some setup possibilities


This indicator helps visualize the Volume Weighted Average Price (VWAP) and its associated standard deviation bands over specified time periods, providing traders with a clear understanding of price trends, volatility, and potential support/resistance levels.
Inputs
Deviation
- StDev mult 1: Multiplier for the first standard deviation band (Default: 1.0)
- StDev mult 2: Multiplier for the second standard deviation band (Default: 2.0)
- StDev mult 3: Multiplier for the third standard deviation band (Default: 3.0)
- StDev mult 4: Multiplier for the fourth standard deviation band (Default: 4.0)
- Line width: Width of the lines for the bands (Default: 2)
Custom Vwap session reset settings
Many different options are considered when a session is going to be reset.
Plot and Fill Options
- Enable Fills: Enable/disable filling between bands.
- Plot +4: Enable/disable plotting the +4 standard deviation band.
- Plot +3: Enable/disable plotting the +3 standard deviation band.
- Plot +2: Enable/disable plotting the +2 standard deviation band.
- Plot +1: Enable/disable plotting the +1 standard deviation band.
- Plot VWAP: Enable/disable plotting the VWAP line.
- Plot -1: Enable/disable plotting the -1 standard deviation band.
- Plot -2: Enable/disable plotting the -2 standard deviation band.
- Plot -3: Enable/disable plotting the -3 standard deviation band.
- Plot -4: Enable/disable plotting the -4 standard deviation band.
How to Use the Indicator
Adding the Indicator
Add the indicator to your chart through your trading platform's indicator menu.
Configuring the VWAP Reset
Specify reset intervals based on time, days of the week, or specific dates.
Adjust the time zone if necessary.
Customizing Standard Deviation Bands
Set the multipliers for the standard deviation bands.
Choose line width for better visualization.
Enabling Plots and Fills
Select which bands to display.
Enable or disable fills between the bands.
Practical Application of VWAP Bands
Understanding VWAP
VWAP is a trading benchmark that calculates the average price a security has traded at throughout the day based on volume and price. It is primarily used for intraday trading but can also offer insights during end-of-day reviews.
Using VWAP for Trading
Intraday Trading
Entry and Exit Points: VWAP can help identify optimal buy and sell points. Buy when the price is above VWAP and sell when it's below.
Support and Resistance: VWAP often acts as a dynamic support/resistance level. Prices tend to revert to VWAP, making it a crucial level for intraday traders.
Trend Confirmation
Uptrends and Downtrends: In an uptrend, the price will generally stay above VWAP. Conversely, in a downtrend, it will stay below. Use this to confirm market direction.
Combining with Other Indicators
Moving Averages and Bollinger Bands: Combining VWAP with these indicators can provide a more robust trading signal, confirming trends and potential reversals.
Setting Stop-Loss and Profit Targets
Conservative Stop Orders: Place stop orders at recent lows for pullback trades.
Profit Targets: Use daily highs or Fibonacci extension levels to set profit targets.
Strategies for Using VWAP
Pullback Strategy
Buy during pullbacks to VWAP in an uptrend, and sell during rallies to VWAP in a downtrend.
Breakout Strategy
Look for breakouts above/below VWAP after the market open to capitalize on new trends.
Momentum Trading
Use VWAP to confirm the strength of a trend. Buy when the price is consistently above VWAP and sell when it's consistently below.
Institutional Strategies
Institutional traders use VWAP to execute large orders without causing significant market impact, ensuring trades are made around the average price.
By incorporating these strategies, traders can better understand market dynamics, make informed trading decisions, and manage their risk effectively.
Some setup possibilities
نص برمجي مفتوح المصدر
بروح TradingView الحقيقية، قام مبتكر هذا النص البرمجي بجعله مفتوح المصدر، بحيث يمكن للمتداولين مراجعة وظائفه والتحقق منها. شكرا للمؤلف! بينما يمكنك استخدامه مجانًا، تذكر أن إعادة نشر الكود يخضع لقواعد الموقع الخاصة بنا.
إخلاء المسؤولية
لا يُقصد بالمعلومات والمنشورات أن تكون، أو تشكل، أي نصيحة مالية أو استثمارية أو تجارية أو أنواع أخرى من النصائح أو التوصيات المقدمة أو المعتمدة من TradingView. اقرأ المزيد في شروط الاستخدام.