PROTECTED SOURCE SCRIPT
Nifty VWAP
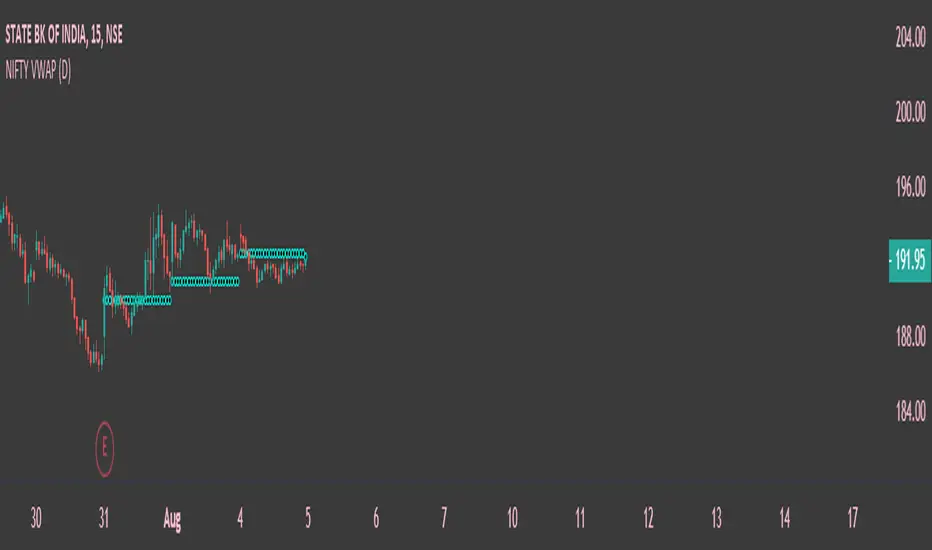
This indicator is based on Indian Indices Nifty and Nifty 50 Stocks . Combination of breadth volumes of Niifty50 stocks to get Nifty Volume , can be used only Nifty50 Index and stocks . This indicator tells you the trend of the index or stocks. If the price is above the Volume weighted average price line its considers as Bullish Trend and if the price is below the Volume weighted average price line its considered as Bearish Trend. Default resolution is Set as Day , can be customized according to ones choice . Hope you guys will like it .
نص برمجي محمي
تم نشر هذا النص البرمجي كمصدر مغلق. ومع ذلك، يمكنك استخدامه بحرية ودون أي قيود - تعرف على المزيد هنا.
إخلاء المسؤولية
لا يُقصد بالمعلومات والمنشورات أن تكون، أو تشكل، أي نصيحة مالية أو استثمارية أو تجارية أو أنواع أخرى من النصائح أو التوصيات المقدمة أو المعتمدة من TradingView. اقرأ المزيد في شروط الاستخدام.