OPEN-SOURCE SCRIPT
تم تحديثه Ladder StDev
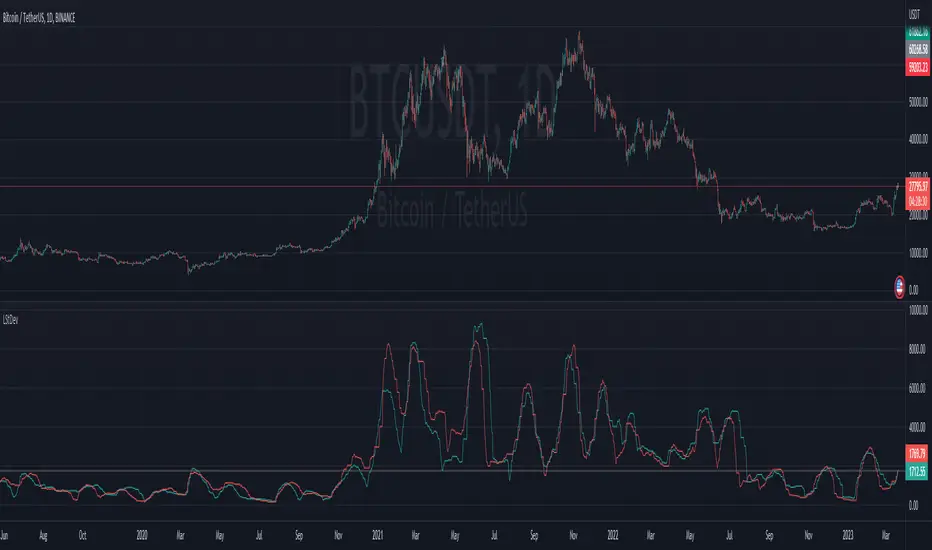
This indicator shows the upwards (green) and downward (red) volatility of the market. It is a standard deviation of the price but with a twist! For the upwards volatility , only the green candles are taken into account, and for the downwards only the red candles are.
Compared to my previous "Ladder ATR" indicator this a different approach to measure the the upwards and downwards volatility of the market by utilizing the standard deviation instead of the ATR. When both measure the volatility they have different "dynamics". Standard deviation increases the weight of larger values over smaller values. The ATR indicator is based on the average of absolute changes. So, if we apply the indicators on a daily chart , ATR considers intraday and between-day data, while the standard deviation calculation includes only daily returns (source price).
Compared to my previous "Ladder ATR" indicator this a different approach to measure the the upwards and downwards volatility of the market by utilizing the standard deviation instead of the ATR. When both measure the volatility they have different "dynamics". Standard deviation increases the weight of larger values over smaller values. The ATR indicator is based on the average of absolute changes. So, if we apply the indicators on a daily chart , ATR considers intraday and between-day data, while the standard deviation calculation includes only daily returns (source price).
ملاحظات الأخبار
- Added RETURN mode that calculate the standard deviation of the log returns.
Many thanks to lejmer for his idea of log return mode and for pointing out to me the (un)biased variable option in the standard deviation calculations.
ملاحظات الأخبار
- Use serries to get the positive and negative stdev values
- Use enum
ملاحظات الأخبار
- Update to pinescript version 6
نص برمجي مفتوح المصدر
بروح TradingView الحقيقية، قام مبتكر هذا النص البرمجي بجعله مفتوح المصدر، بحيث يمكن للمتداولين مراجعة وظائفه والتحقق منها. شكرا للمؤلف! بينما يمكنك استخدامه مجانًا، تذكر أن إعادة نشر الكود يخضع لقواعد الموقع الخاصة بنا.
📧 Contact info
Telegram: @jason5480
🔗 Addresses
₿ - bc1qxh3jeld7ke70fx3r5q243d96jsx0etth6x8fa7
* Please contact me before any donation ☕
Telegram: @jason5480
🔗 Addresses
₿ - bc1qxh3jeld7ke70fx3r5q243d96jsx0etth6x8fa7
* Please contact me before any donation ☕
إخلاء المسؤولية
لا يُقصد بالمعلومات والمنشورات أن تكون، أو تشكل، أي نصيحة مالية أو استثمارية أو تجارية أو أنواع أخرى من النصائح أو التوصيات المقدمة أو المعتمدة من TradingView. اقرأ المزيد في شروط الاستخدام.