Flow of fund (FOF) indicator
Flow of fund (FOF) simply refers to the direction of money in the market. FOF indicator shows how the flow of funds impacts market price.
The idea of this indicator is very intuitive, prices raise when cash flowing into the market and drop when cash flowing out of market.
The calculation of FOF involves three basic but the most important elements of the financial market: TIME, PRICE and VOLUME.
Flow of fund indicator consists of two parts:
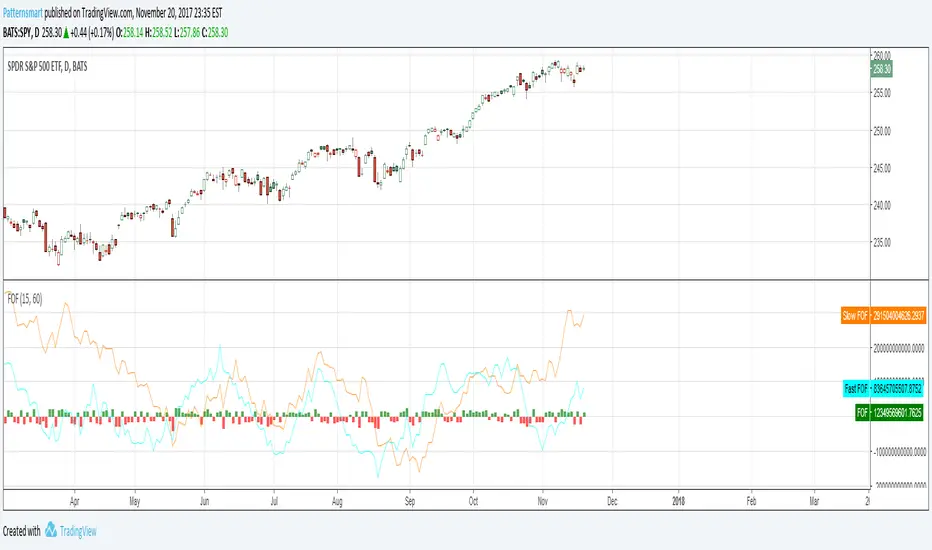
HISTOGRAM shows the total amount of money get in or out of the market within 1 bar.
If selling pressure is stronger than buying pressure, it will be a red bar,
otherwise, it will be a green bar.
Two Flow of fund trend lines, indicating the short and long term movement of money flow.
Fast trend line uses a shorter period of time.
Slow trend line uses a longer period of time.
The length of period of both trend line is adjustable by user.
The orange line in the images is slow FOF, the blue line is fast FOF.
It works within all time period (Tick, Minutes, Daily, Weekly, Monthly) with VOLUME.
نص برمجي للمستخدمين المدعوين فقط
يمكن فقط للمستخدمين الذين تمت الموافقة عليهم من قبل المؤلف الوصول إلى هذا البرنامج النصي. ستحتاج إلى طلب الإذن والحصول عليه لاستخدامه. يتم منح هذا عادةً بعد الدفع. لمزيد من التفاصيل، اتبع تعليمات المؤلف أدناه أو اتصل ب Patternsmart مباشرة.
لا توصي TradingView بالدفع مقابل برنامج نصي أو استخدامه إلا إذا كنت تثق تمامًا في مؤلفه وتفهم كيفية عمله. يمكنك أيضًا العثور على بدائل مجانية ومفتوحة المصدر في نصوص مجتمعنا.
تعليمات المؤلف
إخلاء المسؤولية
نص برمجي للمستخدمين المدعوين فقط
يمكن فقط للمستخدمين الذين تمت الموافقة عليهم من قبل المؤلف الوصول إلى هذا البرنامج النصي. ستحتاج إلى طلب الإذن والحصول عليه لاستخدامه. يتم منح هذا عادةً بعد الدفع. لمزيد من التفاصيل، اتبع تعليمات المؤلف أدناه أو اتصل ب Patternsmart مباشرة.
لا توصي TradingView بالدفع مقابل برنامج نصي أو استخدامه إلا إذا كنت تثق تمامًا في مؤلفه وتفهم كيفية عمله. يمكنك أيضًا العثور على بدائل مجانية ومفتوحة المصدر في نصوص مجتمعنا.