INVITE-ONLY SCRIPT
Waves Corrections

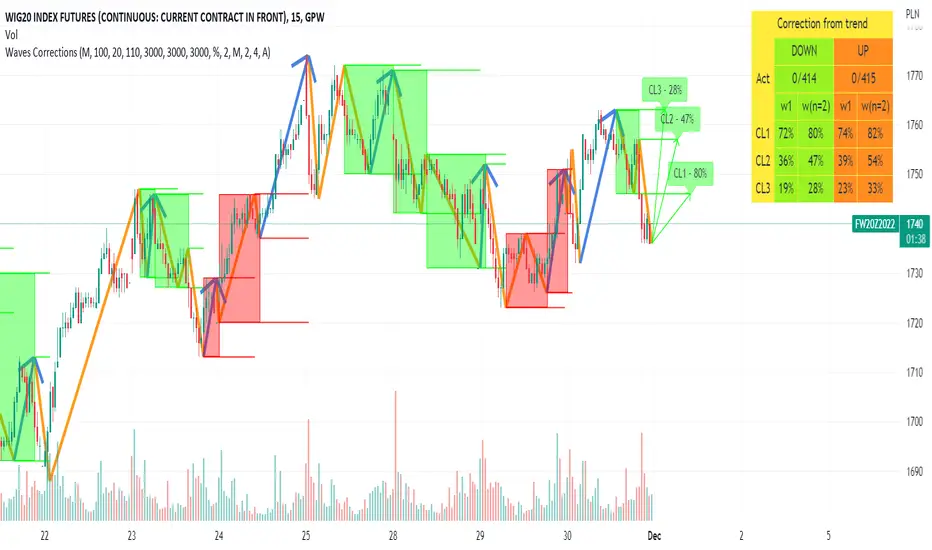
Wave theory tool for tracking waves relations and their corrections. It filters out a sets of formations and count how often correction from them are reaching characteristic correction levels marked on the chart as CL1, CL2, CL3.
It supports 2 rulesets/wave variants:
Low - Based on more sensitive trend detection.
Medium - Based on less sensitive trend detection.
Script settings:
| SCANNER |
Trend type - Trend used by scanner to detect sets of waves.
L - Low
M - Medium
<= W1/W2 * 100% <= - Tresholds describing proportions between 1 and 2 wave in the set.
<= W3/W1 * 100% <= - Tresholds describing proportions between 3 and 1 wave in the set.
<= W3/W2 * 100% <= - Tresholds describing proportions between 3 and 2 wave in the set.
Show potencial areas - Showing underway sets
Show Arrows - Showing arrows with possible correction on underway set.
Correction from trend UP - Background and border colors for found sets in up trends
Correction from trend Down - Bakcground and border colors for found sets in down trends.
History - Showing sets in historic data.
Stats - Type of statistic table shown on the screen:
H - Hide
% - Statistics with normal font
%s - Statistics with small font
Wn n= - Picking how many waves are taken into account when calculating statistics .
| TREND VISUALIZATION |
Type - Trend visualization types:
H - Hidden
L - Low
M - Medium
B - Both
Alfred - AI assistant that informs about wave confirmation or trend changes (With "Both" type Alfred will monit only Medium wave).
Shadow - Showing second reprezentation of the trend with drawing with the use of minimal and maximal values. It's usefull to determine the delay between the peak and a wave change signal.
Low/Med Line width/color - Width/color of drawn line. Separate setting for Low and Medium trend type.
| IMPULS VISUALIZATION |
Impuls - Drawing impuls modes:
H - Hidden
F - First
S - Second
A - Auto
Impuls color - Color of the first bullish arrow.
Draw arrow - Drawing arrow at the end of the first bullish arrow.
Troubleshooting:
In case of any problems, send error details to the author of the script.
نص برمجي للمستخدمين المدعوين فقط
الوصول إلى هذا النص مقيد للمستخدمين المصرح لهم من قبل المؤلف وعادة ما يكون الدفع مطلوباً. يمكنك إضافته إلى مفضلاتك، لكن لن تتمكن من استخدامه إلا بعد طلب الإذن والحصول عليه من مؤلفه. تواصل مع Investor_R للحصول على مزيد من المعلومات، أو اتبع إرشادات المؤلف أدناه.
لا تقترح TradingView الدفع مقابل النصوص البرمجية واستخدامها حتى تثق بنسبة 100٪ في مؤلفها وتفهم كيفية عملها. في كثير من الحالات، يمكنك العثور على بديل جيد مفتوح المصدر مجانًا في نصوص مجتمع الخاصة بنا .
تعليمات المؤلف
″To get access or report problem write on toolkit4trading@gmail.com
هل تريد استخدام هذا النص البرمجي على الرسم البياني؟
تحذير: يرجى القراءة قبل طلب الوصول.
To get access or report problem write on toolkit4trading@proton.me
More details on Website and Youtube.
More details on Website and Youtube.
إخلاء المسؤولية
لا يُقصد بالمعلومات والمنشورات أن تكون، أو تشكل، أي نصيحة مالية أو استثمارية أو تجارية أو أنواع أخرى من النصائح أو التوصيات المقدمة أو المعتمدة من TradingView. اقرأ المزيد في شروط الاستخدام.