OPEN-SOURCE SCRIPT
Cooltoyz: Multi level Bollinger Shadows
Finally, another gadget for the cooltoyz series :)
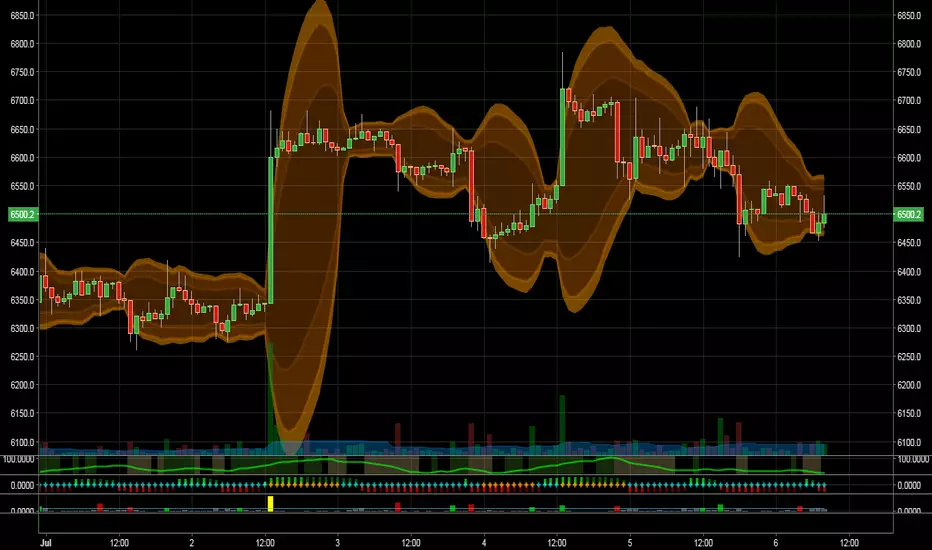
this is a simple tool to allow vizualizing bollinger bands with several values/levels. usually boll bands have the levels at 1.5, 2, 3, for multiplier of standadrd deviations. but, just changing those values, we can apply fibbonnaci levels to the bands.
The inputs on this indicator come with fib levels by default, but the values are part of input fields, so it's easy to change to whatever you prefer, back to the calssic std.deviation values, for example. also, the colors are set to make a visual slope, so it's more instinctive to see how strong the candles are moving.
just play with it, and like it. or not :)
نص برمجي مفتوح المصدر
بروح TradingView الحقيقية، قام مبتكر هذا النص البرمجي بجعله مفتوح المصدر، بحيث يمكن للمتداولين مراجعة وظائفه والتحقق منها. شكرا للمؤلف! بينما يمكنك استخدامه مجانًا، تذكر أن إعادة نشر الكود يخضع لقواعد الموقع الخاصة بنا.
just here for rocketspotting
إخلاء المسؤولية
لا يُقصد بالمعلومات والمنشورات أن تكون، أو تشكل، أي نصيحة مالية أو استثمارية أو تجارية أو أنواع أخرى من النصائح أو التوصيات المقدمة أو المعتمدة من TradingView. اقرأ المزيد في شروط الاستخدام.