PROTECTED SOURCE SCRIPT
تم تحديثه Comprehensive TA Dashboard v10
Comprehensive TA Dashboard v9
Welcome to the Comprehensive Technical Analysis Dashboard v9, an all-in-one indicator designed to provide a clear, customizable, and powerful view of the market. This script combines essential trading tools into a single, cohesive dashboard, allowing you to streamline your analysis and focus on what matters most: making informed trading decisions.
Key Features
This indicator is packed with features, all of which are fully customizable through a clean and organized settings menu.
Core Indicators
Moving Averages: Get a clear view of the trend with four customizable moving averages.
5 & 10 EMA: For short-term momentum.
20 & 200 SMA: For medium and long-term trend analysis.
Defaults are set to green for faster MAs and red for slower MAs, with customizable thickness.
Bollinger Bands: Understand volatility and potential price extremes with fully adjustable Bollinger Bands. Customize the length, standard deviation, and colors for the basis, bands, and fill.
Key Price Levels
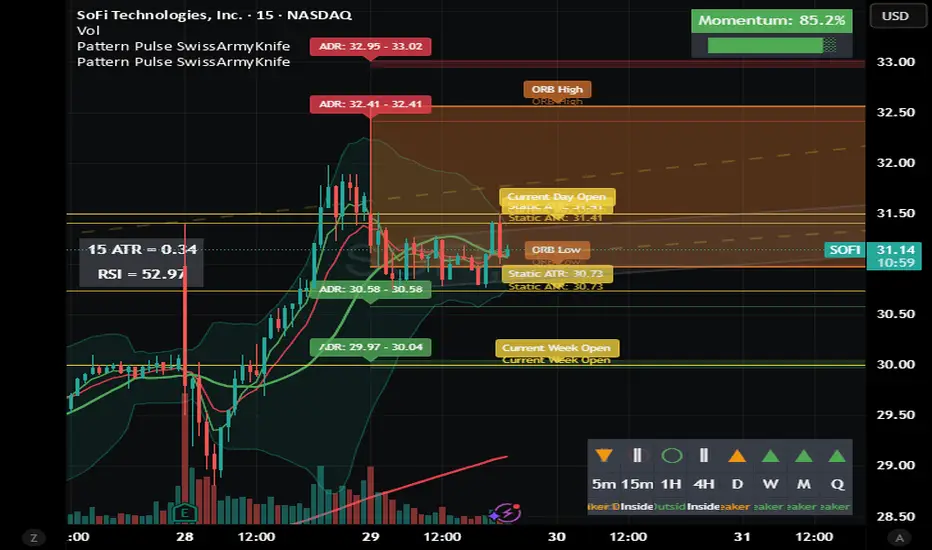
Previous Period Opens: Automatically plot horizontal lines at the opening price of the previous day, week, and month. These key institutional levels often act as powerful support and resistance.
Opening Range Breakout (ORB): Automatically draw the high and low of the initial trading period (default is the first 15 minutes). These levels are crucial for intraday breakout strategies.
Fully customizable session times and range period.
Customize line color and width for the ORB high and low.
Real-Time Data & Projections
Dual ATR Rays: Project potential price boundaries with two distinct ATR modes.
Static ATR (For Market Hours): A non-repainting level based on the previous candle's close. Provides a stable, reliable target during live trading.
Live ATR (For After-Hours Planning): A dynamic level based on the current price. Perfect for planning and projecting potential ranges for the next trading session.
On-Screen Data Table: Keep essential data in view without cluttering your chart.
Displays the non-repainting ATR and RSI values for the most recently closed candle.
Positioned on the middle-left of the chart for easy reference.
Multi-Timeframe Analysis
Timeframe Continuity Tracker: Get an at-a-glance view of market momentum across multiple timeframes.
Displays boxes for 5m, 15m, 1H, 4H, Day, Week, Month, and Quarter.
Boxes are color-coded green for a bullish candle and red for a bearish candle, providing instant insight into the overall trend alignment.
How to Use This Indicator
Global Toggles: Use the "Global Visibility" section in the settings to quickly turn entire feature sets on or off.
Customize Your View: Dive into the detailed settings for each feature group to adjust lengths, colors, and line styles to match your personal trading strategy.
Combine the Tools:
Use the Moving Averages and Timeframe Continuity Tracker to establish the dominant trend.
Identify key levels of interest with the Previous Period Opens and ORB lines.
Use the ATR Rays and Bollinger Bands to set realistic profit targets and understand potential volatility for the session.
This script was designed to be the only indicator you need on your chart. It's powerful, flexible, and built with clean, non-repainting data to ensure you're trading with the most reliable information possible.
Enjoy, and happy trading!
Welcome to the Comprehensive Technical Analysis Dashboard v9, an all-in-one indicator designed to provide a clear, customizable, and powerful view of the market. This script combines essential trading tools into a single, cohesive dashboard, allowing you to streamline your analysis and focus on what matters most: making informed trading decisions.
Key Features
This indicator is packed with features, all of which are fully customizable through a clean and organized settings menu.
Core Indicators
Moving Averages: Get a clear view of the trend with four customizable moving averages.
5 & 10 EMA: For short-term momentum.
20 & 200 SMA: For medium and long-term trend analysis.
Defaults are set to green for faster MAs and red for slower MAs, with customizable thickness.
Bollinger Bands: Understand volatility and potential price extremes with fully adjustable Bollinger Bands. Customize the length, standard deviation, and colors for the basis, bands, and fill.
Key Price Levels
Previous Period Opens: Automatically plot horizontal lines at the opening price of the previous day, week, and month. These key institutional levels often act as powerful support and resistance.
Opening Range Breakout (ORB): Automatically draw the high and low of the initial trading period (default is the first 15 minutes). These levels are crucial for intraday breakout strategies.
Fully customizable session times and range period.
Customize line color and width for the ORB high and low.
Real-Time Data & Projections
Dual ATR Rays: Project potential price boundaries with two distinct ATR modes.
Static ATR (For Market Hours): A non-repainting level based on the previous candle's close. Provides a stable, reliable target during live trading.
Live ATR (For After-Hours Planning): A dynamic level based on the current price. Perfect for planning and projecting potential ranges for the next trading session.
On-Screen Data Table: Keep essential data in view without cluttering your chart.
Displays the non-repainting ATR and RSI values for the most recently closed candle.
Positioned on the middle-left of the chart for easy reference.
Multi-Timeframe Analysis
Timeframe Continuity Tracker: Get an at-a-glance view of market momentum across multiple timeframes.
Displays boxes for 5m, 15m, 1H, 4H, Day, Week, Month, and Quarter.
Boxes are color-coded green for a bullish candle and red for a bearish candle, providing instant insight into the overall trend alignment.
How to Use This Indicator
Global Toggles: Use the "Global Visibility" section in the settings to quickly turn entire feature sets on or off.
Customize Your View: Dive into the detailed settings for each feature group to adjust lengths, colors, and line styles to match your personal trading strategy.
Combine the Tools:
Use the Moving Averages and Timeframe Continuity Tracker to establish the dominant trend.
Identify key levels of interest with the Previous Period Opens and ORB lines.
Use the ATR Rays and Bollinger Bands to set realistic profit targets and understand potential volatility for the session.
This script was designed to be the only indicator you need on your chart. It's powerful, flexible, and built with clean, non-repainting data to ensure you're trading with the most reliable information possible.
Enjoy, and happy trading!
ملاحظات الأخبار
Comprehensive TA Dashboard v10Welcome to the Comprehensive Technical Analysis Dashboard v10, an all-in-one indicator designed to provide a clear, customizable, and powerful view of the market. This script combines essential trading tools into a single, cohesive dashboard, allowing you to streamline your analysis and focus on what matters most: making informed trading decisions.
What's New in v10?
Previous Yearly Open: Added a horizontal line for the previous year's opening price, providing a major long-term level.
Shaded Opening Range: The area between the ORB high and low is now shaded for clear, at-a-glance visibility.
New Default Styling: Key levels (Previous Opens, ORB, and ATR Rays) now default to a clean orange, dashed style for better chart harmony.
Key Features
This indicator is packed with features, all of which are fully customizable through a clean and organized settings menu.
Core Indicators
Moving Averages: Get a clear view of the trend with four customizable moving averages.
5 & 10 EMA: For short-term momentum.
20 & 200 SMA: For medium and long-term trend analysis.
Bollinger Bands: Understand volatility and potential price extremes with fully adjustable Bollinger Bands. Customize the length, standard deviation, and colors for the basis, bands, and fill.
Key Price Levels
Previous Period Opens: Automatically plot horizontal lines at the opening price of the previous day, week, month, and year. These key institutional levels often act as powerful support and resistance.
Opening Range Breakout (ORB): Automatically draw and shade the high and low of the initial trading period (default is the first 15 minutes). These levels are crucial for intraday breakout strategies.
Real-Time Data & Projections
Dual ATR Rays: Project potential price boundaries with two distinct ATR modes.
Static ATR (For Market Hours): A non-repainting level based on the previous candle's close. Provides a stable, reliable target during live trading.
Live ATR (For After-Hours Planning): A dynamic level based on the current price. Perfect for planning and projecting potential ranges for the next trading session.
On-Screen Data Table: Keep essential data in view without cluttering your chart.
Displays the non-repainting ATR and RSI values for the most recently closed candle.
Multi-Timeframe Analysis
Timeframe Continuity Tracker: Get an at-a-glance view of market momentum across multiple timeframes.
Displays boxes for 5m, 15m, 1H, 4H, Day, Week, Month, and Quarter.
Boxes are color-coded green for a bullish candle and red for a bearish candle.
How to Use This Indicator
Global Toggles: Use the "Global Visibility" section in the settings to quickly turn entire feature sets on or off.
Customize Your View: Dive into the detailed settings for each feature group to adjust lengths, colors, and line styles to match your personal trading strategy.
Combine the Tools:
Use the Moving Averages and Timeframe Continuity Tracker to establish the dominant trend.
Identify key levels of interest with the Previous Period Opens and ORB lines.
Use the ATR Rays and Bollinger Bands to set realistic profit targets and understand potential volatility.
This script was designed to be the only indicator you need on your chart. It's powerful, flexible, and built with clean, non-repainting data to ensure you're trading with the most reliable information possible. Enjoy!
ملاحظات الأخبار
Key Features & Enhancements1. Dynamic, Multi-Timeframe Opening Range Breakout (ORB)
Real-time Drawing: The ORB high, low, and shaded range now draw and update live as the opening range forms, rather than waiting for the period to conclude.
Timeframe Independent: The ORB is now calculated using a 1-minute timeframe behind the scenes. This ensures the true opening range is accurately displayed on any chart timeframe (5m, 10m, 15m, 1H, etc.) without distortion.
Visual Clarity: The ORB is now visually represented by a shaded region, making it easier to identify at a glance.
2. Advanced Label & Display Customization
Individual Label Offsets: To prevent labels from overlapping, you now have independent horizontal offset controls for three distinct groups:
Opening Range Breakout
Previous Period Opens
ATR Rays
Streamlined Settings UI: The "Global Visibility" section has been reorganized into a compact, two-column layout, and redundant wording has been removed for a cleaner user experience.
3. Enhanced Moving Average Configuration
Custom Default Styles: Moving Averages now have updated, more intuitive defaults:
5 & 10 EMA: Default to a solid line with a width of 1.
20 & 200 SMA: Default to a dashed line with a width of 2.
Style Selector: You can now easily toggle the style for each moving average between "Solid" and "Dashed" directly in the settings.
4. New Default Trading Settings
The script's default settings have been updated based on your preferences for a more personalized out-of-the-box experience:
ORB Period: Defaulted to 30 minutes with a 20% fill opacity.
Line Colors & Widths: Previous Period Open and ORB lines now use your preferred orange color scheme and line widths.
Label Offsets: Default offsets for PPO and ORB labels have been adjusted for optimal placement.
Bug Fixes
Compiler Errors: Corrected various Pine Script errors related to undeclared identifiers and incorrect function calls, ensuring the script is stable and runs without issues.
MA Plotting: Fixed an issue with moving average plot styles to ensure they are drawn correctly.
ملاحظات الأخبار
New Major Feature: Automated Broadening FormationsAutomatic Detection: The indicator now automatically detects and draws broadening "megaphone" patterns on the chart.
Intelligent Drawing Logic: Patterns are validated to ensure they are true broadening formations. The top line is only drawn for a confirmed higher high, and the bottom line is only drawn for a confirmed lower low.
Full Customization: In the settings, you can now control:
Pivot sensitivity (left and right bars).
Upper and lower line color, width, and style (Solid, Dotted, Dashed).
Major Enhancements & Fixes
Opening Range Breakout (ORB) Overhaul:
Multi-Timeframe Compatibility: The ORB is now calculated using a 1-minute timeframe behind the scenes. This ensures the true opening range is displayed accurately on any chart timeframe you view (5m, 15m, 1H, etc.).
Real-Time Drawing: The ORB lines and shaded area now draw and update dynamically as the opening range forms, not just after it's complete.
Visual Polish: Added a customizable shaded fill between the high and low lines for better visibility.
User Interface & Experience (UX) Improvements:
Complete Label Control: Added individual horizontal offset settings for ORB, Previous Period Opens, and ATR labels, eliminating overlap issues and giving you full control over the chart's appearance.
Streamlined Settings Menu: The "Global Visibility" toggles have been reorganized into a cleaner, two-column layout. The redundant word "Show" was removed from each title for a more compact look.
Global ATR Toggle: Replaced the "ATR Price Labels" switch with a more intuitive master "ATR Rays" toggle in the Global Visibility section for one-click control.
Default Settings & Style Updates:
New Moving Average Defaults:
5 & 10 EMA: Default to a solid line with a width of 1.
20 & 200 SMA: Default to a dashed line with a width of 2.
Default colors have been updated for better visual distinction.
New ORB & PPO Defaults: Updated default colors, line widths, label offsets, and the ORB period to your preferred settings.
ملاحظات الأخبار
Overall Bug Fixes...نص برمجي محمي
تم نشر هذا النص البرمجي كمصدر مغلق. ومع ذلك، يمكنك استخدامه بحرية ودون أي قيود - تعرف على المزيد هنا.
إخلاء المسؤولية
لا يُقصد بالمعلومات والمنشورات أن تكون، أو تشكل، أي نصيحة مالية أو استثمارية أو تجارية أو أنواع أخرى من النصائح أو التوصيات المقدمة أو المعتمدة من TradingView. اقرأ المزيد في شروط الاستخدام.
نص برمجي محمي
تم نشر هذا النص البرمجي كمصدر مغلق. ومع ذلك، يمكنك استخدامه بحرية ودون أي قيود - تعرف على المزيد هنا.
إخلاء المسؤولية
لا يُقصد بالمعلومات والمنشورات أن تكون، أو تشكل، أي نصيحة مالية أو استثمارية أو تجارية أو أنواع أخرى من النصائح أو التوصيات المقدمة أو المعتمدة من TradingView. اقرأ المزيد في شروط الاستخدام.