OPEN-SOURCE SCRIPT
Bollinger Histogram
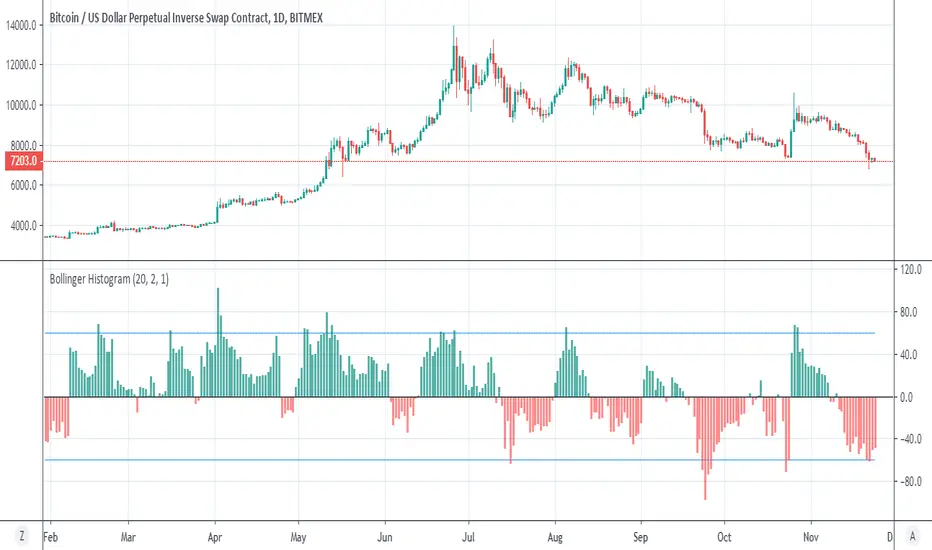
In the same way that I make the donchian histogram , we can make a histogram for bollinger
above zero =buy , green color
bellow zero =sell. red color
try to play with setting to get optimal results
above zero =buy , green color
bellow zero =sell. red color
try to play with setting to get optimal results
نص برمجي مفتوح المصدر
بروح TradingView الحقيقية، قام مبتكر هذا النص البرمجي بجعله مفتوح المصدر، بحيث يمكن للمتداولين مراجعة وظائفه والتحقق منها. شكرا للمؤلف! بينما يمكنك استخدامه مجانًا، تذكر أن إعادة نشر الكود يخضع لقواعد الموقع الخاصة بنا.
إخلاء المسؤولية
لا يُقصد بالمعلومات والمنشورات أن تكون، أو تشكل، أي نصيحة مالية أو استثمارية أو تجارية أو أنواع أخرى من النصائح أو التوصيات المقدمة أو المعتمدة من TradingView. اقرأ المزيد في شروط الاستخدام.