OPEN-SOURCE SCRIPT
تم تحديثه Price Change History

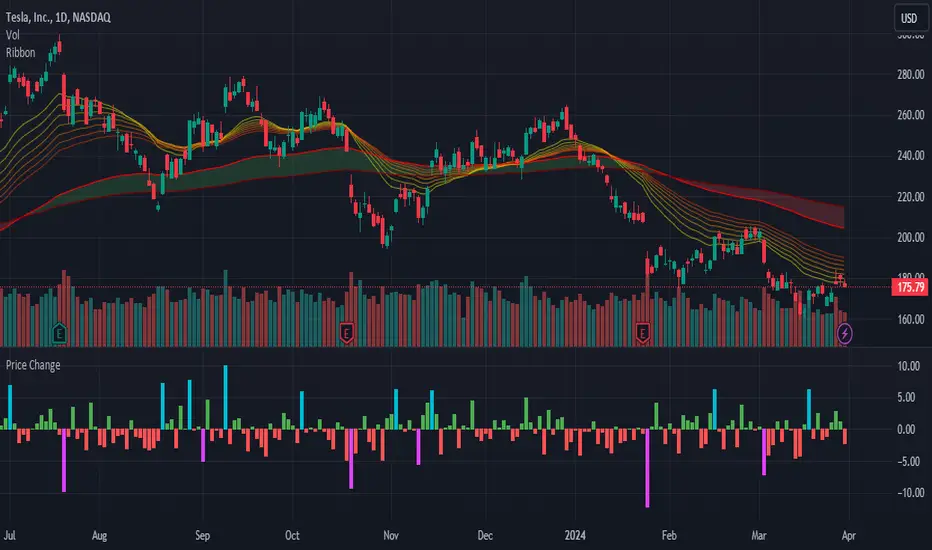
Display a histogram of price changes over a given interval. Show change as a percentage or in dollar amount. Highlight changes that exceed a particular value.
ملاحظات الأخبار
By default, the histogram shows price change since the previous bar. This update allows you to display price change since any number of bars ago.ملاحظات الأخبار
Separate high and low highlighting.ملاحظات الأخبار
Update study shorttitle.ملاحظات الأخبار
The ratio of highlighted to unhighlighted bars is now shown as the orange number ranging from 0 to 1.It takes into consideration the previous 50 bars by default, but can be changed by the user under settings.
ملاحظات الأخبار
- Updated the names of a few settings to be clearer as to what they do.- Included some documentation in the source code to explain each setting.
ملاحظات الأخبار
- Add default precision
- Improve comments
ملاحظات الأخبار
Updated to Pine Script v4ملاحظات الأخبار
- Update to Pine Script v5- Additional comments
- Code cleanup
نص برمجي مفتوح المصدر
بروح TradingView الحقيقية، قام مبتكر هذا النص البرمجي بجعله مفتوح المصدر، بحيث يمكن للمتداولين مراجعة وظائفه والتحقق منها. شكرا للمؤلف! بينما يمكنك استخدامه مجانًا، تذكر أن إعادة نشر الكود يخضع لقواعد الموقع الخاصة بنا.
إخلاء المسؤولية
لا يُقصد بالمعلومات والمنشورات أن تكون، أو تشكل، أي نصيحة مالية أو استثمارية أو تجارية أو أنواع أخرى من النصائح أو التوصيات المقدمة أو المعتمدة من TradingView. اقرأ المزيد في شروط الاستخدام.