OPEN-SOURCE SCRIPT
تم تحديثه Autofib Extensions | DTD
Hello trader comuunity!
I'm introducing another script that is part of my main day-trading strategy. We all know regardless of what strategy we use, we need to know what levels offer the least amount of risk to our trade entry and a great tool to anticipate how far a move might go or what level a move may retrace to are the Fibonacci Retracement and Extensions. This indicator combines both together, but with a twist.
The main elements of the script are:
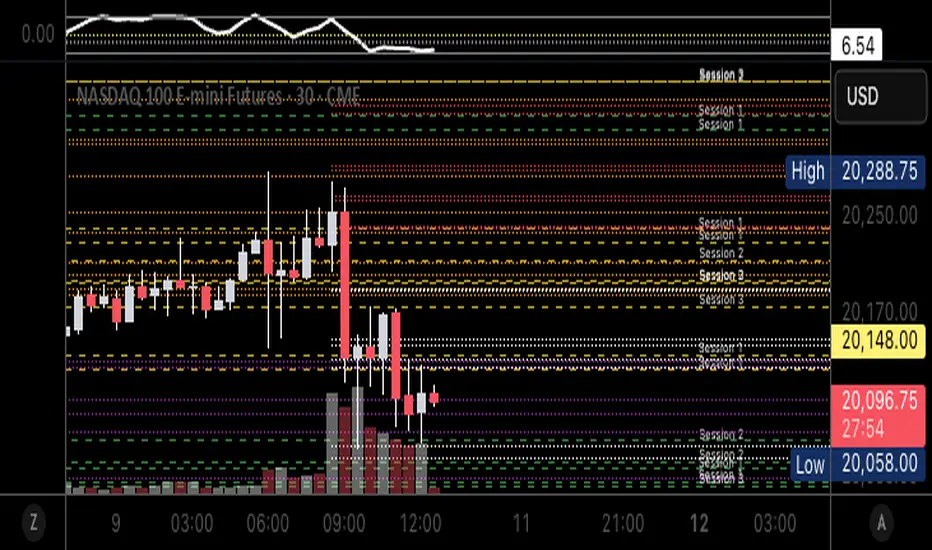
1. Multiple Session High and Lows | Developing my first script led me to understand that measuring key times during each session provides understanding of the market's continuity. I have provided 3 "sessions' a user can define according to CST time where the script saves the high and low of that session window to produce the retracement and extensions from those plots. Currently, the levels are always plotted from low to high (with the 0 mark being the high) and negative values provided so the levels are consistent. You can toggle each session on or off.
2. Coloring Key Retracements / Extensions | I use a dark background for my charts so the default colors help me distinguish from other another indicator I use. Feel free to adjust the colors to your preference. I consider 3 different colors because of their significance. Retracements that you want to see continue fall back into the .50 to .618 level (this I consider the "Golden Zone"). While basic Elliott Wave Theory states a wave is completed near the 1.618 level (this I consider "Major Extensions"). Everything isn't noise, but minor levels in a larger sequence.
______________
Script Limitations
All of my scripts are made with the help of ChatGPT so there are going to be limitations. One current one that I have made progress on, but not fully is when you are viewing a timeframe where the candle doesn't start when a session window starts. On smaller timeframes like the 7-minute this is not an issue. However, on the hourly, if your session window starts at the half hour which the 3rd session default window does, the lines will not produce. I will hopefully have this rectified in the near future. I will open the script since none of this work is original in nature and I would love to see how others can create a better product. Also, this is mainly a futures trading tool. If you are using this on stocks you will find it not as useful if the session window is too wide since the script waits until the session window closes to calculate the extension values.
Cheers,
DTD
I'm introducing another script that is part of my main day-trading strategy. We all know regardless of what strategy we use, we need to know what levels offer the least amount of risk to our trade entry and a great tool to anticipate how far a move might go or what level a move may retrace to are the Fibonacci Retracement and Extensions. This indicator combines both together, but with a twist.
The main elements of the script are:
1. Multiple Session High and Lows | Developing my first script led me to understand that measuring key times during each session provides understanding of the market's continuity. I have provided 3 "sessions' a user can define according to CST time where the script saves the high and low of that session window to produce the retracement and extensions from those plots. Currently, the levels are always plotted from low to high (with the 0 mark being the high) and negative values provided so the levels are consistent. You can toggle each session on or off.
2. Coloring Key Retracements / Extensions | I use a dark background for my charts so the default colors help me distinguish from other another indicator I use. Feel free to adjust the colors to your preference. I consider 3 different colors because of their significance. Retracements that you want to see continue fall back into the .50 to .618 level (this I consider the "Golden Zone"). While basic Elliott Wave Theory states a wave is completed near the 1.618 level (this I consider "Major Extensions"). Everything isn't noise, but minor levels in a larger sequence.
______________
Script Limitations
All of my scripts are made with the help of ChatGPT so there are going to be limitations. One current one that I have made progress on, but not fully is when you are viewing a timeframe where the candle doesn't start when a session window starts. On smaller timeframes like the 7-minute this is not an issue. However, on the hourly, if your session window starts at the half hour which the 3rd session default window does, the lines will not produce. I will hopefully have this rectified in the near future. I will open the script since none of this work is original in nature and I would love to see how others can create a better product. Also, this is mainly a futures trading tool. If you are using this on stocks you will find it not as useful if the session window is too wide since the script waits until the session window closes to calculate the extension values.
Cheers,
DTD
ملاحظات الأخبار
Hello trader comuunity!I'm introducing another script that is part of my main day-trading strategy. We all know regardless of what strategy we use, we need to know what levels offer the least amount of risk to our trade entry and a great tool to anticipate how far a move might go or what level a move may retrace to are the Fibonacci Retracement and Extensions. This indicator encompasses these elements, but from more meaningful user-defined extremes.
The main elements of the script are:
1. Fibonacci Retracement and Extensions from Multiple Session High and Lows | Developing my first script led me to understand that measuring key times during each session provides understanding of the market's continuity. I have provided 3 "sessions' a user can define according to CST time where the script saves the high and low of that session window to produce the retracement and extensions from those plots. Currently, the levels are always plotted from low to high (with the 0 mark being the high) and negative values provided so the levels are consistent. You can toggle each session on or off.
The levels provided are:
-5.272, -4.32, -3.618, -2.618, -2, -1.618, -1.5, -0.783, -0.618, -0.5, -0.382, 0, 0.382
0.5, 0.618, 0.783, 1, 1.5, 1.618, 2, 2.618, 3.618, 4.32, 5.272
2. Coloring Key Retracements / Extensions | I use a dark background for my charts so the default colors help me distinguish from other indicators I use. Feel free to adjust the colors to your preference. I consider 3 different colors because of their significance. Retracements that you want to see continue fall back into are the .50 to .618 level (this I consider the "Golden Zone"), while basic Elliott Wave Theory states a wave is completed near the 1.618 extension (this I consider "Major Extensions"). With a recent update you can now toggle for each category of fibs. This allows for deeper focus on key areas (to wisely be used in conjunction with other indicators) while also allowing for more trade opportunities with minor retracement levels.
______________
Script Limitations
All of my scripts are made with the help of ChatGPT so there are going to be limitations due to me not being proficient in Pinescript. One current limitation that I have made progress on, but not fully is when you are viewing a timeframe where the candle doesn't start when a session window starts. On smaller timeframes like the 7-minute this is not an issue. However, on the 4-hour if you have two session windows within a 4-hour span, the lines will not produce. I will hopefully have this rectified in the near future. I will open the script since none of this work is original in nature and I would love to see how others can create a better product. Also, this is mainly a futures trading tool. If you are using this on stocks you will find it not as useful if the session window is too wide since the script waits until the session window closes to calculate the extension values. However, I personally use this for the opening range (first hour of the NY session) to get key levels for the day.
Cheers,
DTD
ملاحظات الأخبار
Bear with me as I am new to publishing scripts, but here are the recent release updates:1. You can now toggle retracement lines - choose which lines are of most significance to you. Keep your trading better in context and with less noise from other lines
2. Session window labels - choose the color of and offset deviation of session line labels to help with more context to your trades
Cheers,
DTD
نص برمجي مفتوح المصدر
بروح TradingView الحقيقية، قام مبتكر هذا النص البرمجي بجعله مفتوح المصدر، بحيث يمكن للمتداولين مراجعة وظائفه والتحقق منها. شكرا للمؤلف! بينما يمكنك استخدامه مجانًا، تذكر أن إعادة نشر الكود يخضع لقواعد الموقع الخاصة بنا.
إخلاء المسؤولية
لا يُقصد بالمعلومات والمنشورات أن تكون، أو تشكل، أي نصيحة مالية أو استثمارية أو تجارية أو أنواع أخرى من النصائح أو التوصيات المقدمة أو المعتمدة من TradingView. اقرأ المزيد في شروط الاستخدام.