OPEN-SOURCE SCRIPT
Triple HMA Bands (1.2 / 1.4 / 1.6)
📈 Triple HMA Bands — Custom Volatility & Trend Indicator
Description:
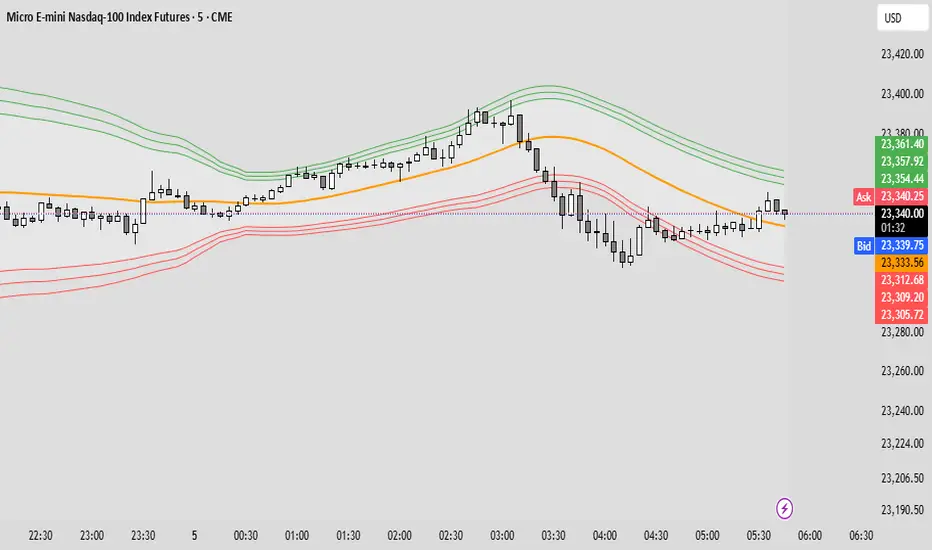
The Triple HMA Bands indicator combines the Hull Moving Average (HMA) with volatility-based envelopes, similar to Bollinger Bands, to visualize trend direction and market extremes.
The HMA (length 90) serves as the central trend line, offering a smooth and responsive view of market direction.
Surrounding the HMA are three dynamic bands calculated using standard deviations of price:
Inner Band (1.2σ) — normal volatility range.
Middle Band (1.4σ) — elevated volatility zone.
Outer Band (1.6σ) — statistically extreme price movement.
The shaded zones between the bands help visualize volatility expansion and contraction, making it easier to identify:
Trend strength and stability
Potential reversal zones
Breakout or breakdown events
How to Use:
Price staying within the inner band may indicate a stable trend or consolidation.
Price reaching or exceeding the outer band suggests overbought/oversold conditions and potential reversal.
Widening bands = rising volatility; narrowing bands = low volatility, often before a breakout.
This indicator is ideal for trend traders, mean reversion strategies, or anyone wanting a volatility-sensitive trend filter.
Description:
The Triple HMA Bands indicator combines the Hull Moving Average (HMA) with volatility-based envelopes, similar to Bollinger Bands, to visualize trend direction and market extremes.
The HMA (length 90) serves as the central trend line, offering a smooth and responsive view of market direction.
Surrounding the HMA are three dynamic bands calculated using standard deviations of price:
Inner Band (1.2σ) — normal volatility range.
Middle Band (1.4σ) — elevated volatility zone.
Outer Band (1.6σ) — statistically extreme price movement.
The shaded zones between the bands help visualize volatility expansion and contraction, making it easier to identify:
Trend strength and stability
Potential reversal zones
Breakout or breakdown events
How to Use:
Price staying within the inner band may indicate a stable trend or consolidation.
Price reaching or exceeding the outer band suggests overbought/oversold conditions and potential reversal.
Widening bands = rising volatility; narrowing bands = low volatility, often before a breakout.
This indicator is ideal for trend traders, mean reversion strategies, or anyone wanting a volatility-sensitive trend filter.
نص برمجي مفتوح المصدر
بروح TradingView الحقيقية، قام مبتكر هذا النص البرمجي بجعله مفتوح المصدر، بحيث يمكن للمتداولين مراجعة وظائفه والتحقق منها. شكرا للمؤلف! بينما يمكنك استخدامه مجانًا، تذكر أن إعادة نشر الكود يخضع لقواعد الموقع الخاصة بنا.
إخلاء المسؤولية
لا يُقصد بالمعلومات والمنشورات أن تكون، أو تشكل، أي نصيحة مالية أو استثمارية أو تجارية أو أنواع أخرى من النصائح أو التوصيات المقدمة أو المعتمدة من TradingView. اقرأ المزيد في شروط الاستخدام.