PROTECTED SOURCE SCRIPT
Multiple Timeframe Bollinger Bands - 15m, 1h, 4h plus current
I could not find any other indicator that does this on TradingView. I like to trade whilst looking at multiple time frames and on my desktop I can do that because I have three monitors. I went on vacation recently and I had to trade using my laptop. It sucked tabbing back and forth so I wrote this script.
I personally trade on a 1m chart with indicator data from longer charts so I get the fastest resolution possible. TradingView's horrid and useless idea posting algorithm won't let me post this script in that way so here's a 30 minute chart for posterity.
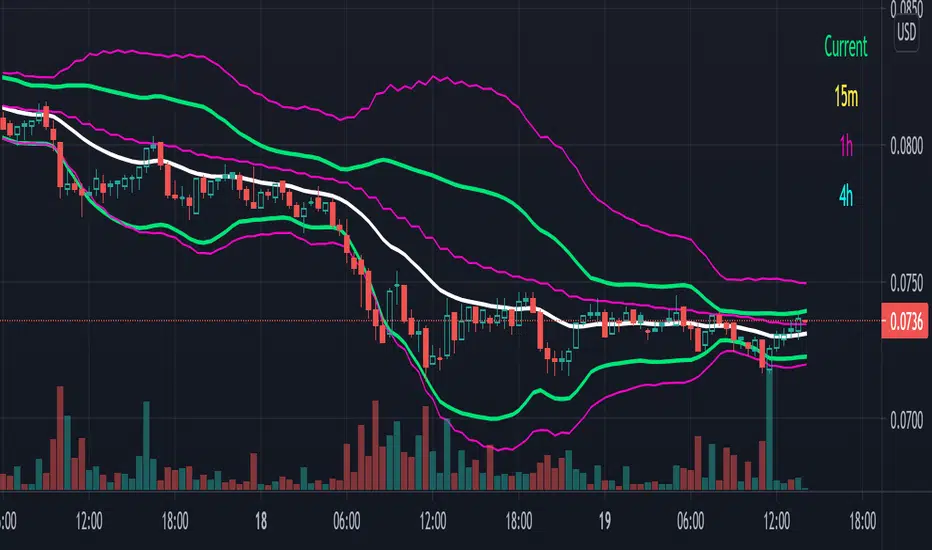
By default it shows only the time frame you are on but you can use the gear icon on the indicator to turn on 15 minute, 1 hour or 4 hour Bollinger bands. There is a color coded guide on the upper right hand side (yay for the new table feature) so you can see what you are getting yourself into. I have 1h bands and current frame (30m) bands on in the picture.
Use this on a fast chart with slower bands applied. It doesn't work all that well when you use it on a longer time frame with faster bands applied. I use this one a 1m or 5m chart with 15m and either 1h or 4h bands applied typically.
I am making use of this available for free though if you want my code to make adjustments it is available for a small donation to cover my development time; PM me if you are interested. My best bot strategies have all been based on this script so if you want to use this as a jumping off point for your Bollinger band-based strategies this will work well though you do need to buy the code from me for that.
I personally trade on a 1m chart with indicator data from longer charts so I get the fastest resolution possible. TradingView's horrid and useless idea posting algorithm won't let me post this script in that way so here's a 30 minute chart for posterity.
By default it shows only the time frame you are on but you can use the gear icon on the indicator to turn on 15 minute, 1 hour or 4 hour Bollinger bands. There is a color coded guide on the upper right hand side (yay for the new table feature) so you can see what you are getting yourself into. I have 1h bands and current frame (30m) bands on in the picture.
Use this on a fast chart with slower bands applied. It doesn't work all that well when you use it on a longer time frame with faster bands applied. I use this one a 1m or 5m chart with 15m and either 1h or 4h bands applied typically.
I am making use of this available for free though if you want my code to make adjustments it is available for a small donation to cover my development time; PM me if you are interested. My best bot strategies have all been based on this script so if you want to use this as a jumping off point for your Bollinger band-based strategies this will work well though you do need to buy the code from me for that.
نص برمجي محمي
تم نشر هذا النص البرمجي كمصدر مغلق. ومع ذلك، يمكنك استخدامه بحرية ودون أي قيود - تعرف على المزيد هنا.
إخلاء المسؤولية
لا يُقصد بالمعلومات والمنشورات أن تكون، أو تشكل، أي نصيحة مالية أو استثمارية أو تجارية أو أنواع أخرى من النصائح أو التوصيات المقدمة أو المعتمدة من TradingView. اقرأ المزيد في شروط الاستخدام.