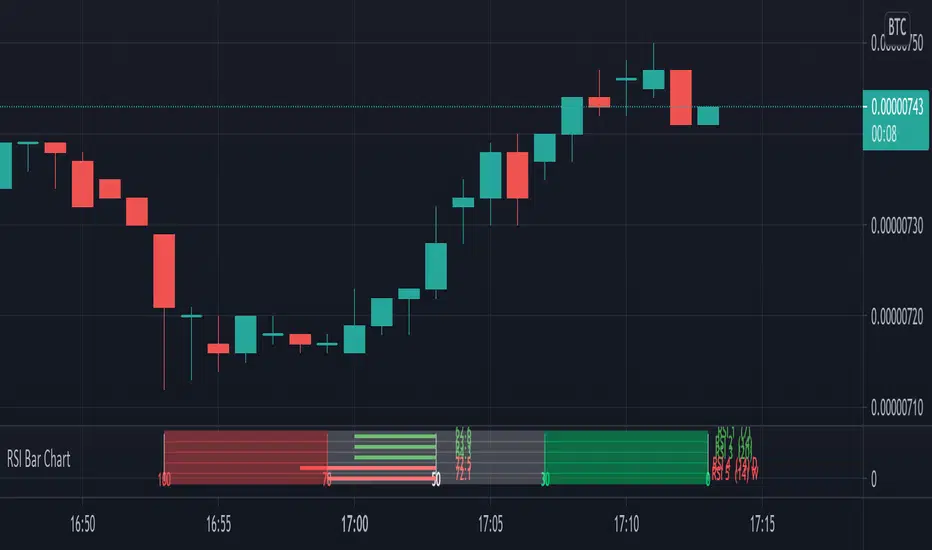
A different way to plot several RSI at once,
5 RSI with different options:
- source, length, timeframe
- size of indicator (width)
- color change
- limit change (30, 70), labels will be changed accordingly
- type of RSI line (line, arrow), linewidth
- offset label (at the right)
There are 4 colors (RSI line)
- when RSI > sell limit
- when RSI > 50 but below sell limit
- when RSI < 50 but above buy limit
- when RSI < buy limit


Arrows:

Different size:


Cheers!
5 RSI with different options:
- source, length, timeframe
- size of indicator (width)
- color change
- limit change (30, 70), labels will be changed accordingly
- type of RSI line (line, arrow), linewidth
- offset label (at the right)
There are 4 colors (RSI line)
- when RSI > sell limit
- when RSI > 50 but below sell limit
- when RSI < 50 but above buy limit
- when RSI < buy limit
Arrows:
Different size:
Cheers!
ملاحظات الأخبار
Now every number (label) is changed when the label size is adjustedAlso shortened the script by adding f_rsi()
ملاحظات الأخبار
Small bug fix -> labels at the right are now visible on symbols sessions that stop in the weekendملاحظات الأخبار
Blurry text/lines fixملاحظات الأخبار
Updateنص برمجي مفتوح المصدر
بروح TradingView الحقيقية، قام مبتكر هذا النص البرمجي بجعله مفتوح المصدر، بحيث يمكن للمتداولين مراجعة وظائفه والتحقق منها. شكرا للمؤلف! بينما يمكنك استخدامه مجانًا، تذكر أن إعادة نشر الكود يخضع لقواعد الموقع الخاصة بنا.
Who are PineCoders?
tradingview.com/chart/SSP/yW5eOqtm-Who-are-PineCoders/
TG Pine Script® Q&A: t.me/PineCodersQA
- We cannot control our emotions,
but we can control our keyboard -
tradingview.com/chart/SSP/yW5eOqtm-Who-are-PineCoders/
TG Pine Script® Q&A: t.me/PineCodersQA
- We cannot control our emotions,
but we can control our keyboard -
إخلاء المسؤولية
لا يُقصد بالمعلومات والمنشورات أن تكون، أو تشكل، أي نصيحة مالية أو استثمارية أو تجارية أو أنواع أخرى من النصائح أو التوصيات المقدمة أو المعتمدة من TradingView. اقرأ المزيد في شروط الاستخدام.
نص برمجي مفتوح المصدر
بروح TradingView الحقيقية، قام مبتكر هذا النص البرمجي بجعله مفتوح المصدر، بحيث يمكن للمتداولين مراجعة وظائفه والتحقق منها. شكرا للمؤلف! بينما يمكنك استخدامه مجانًا، تذكر أن إعادة نشر الكود يخضع لقواعد الموقع الخاصة بنا.
Who are PineCoders?
tradingview.com/chart/SSP/yW5eOqtm-Who-are-PineCoders/
TG Pine Script® Q&A: t.me/PineCodersQA
- We cannot control our emotions,
but we can control our keyboard -
tradingview.com/chart/SSP/yW5eOqtm-Who-are-PineCoders/
TG Pine Script® Q&A: t.me/PineCodersQA
- We cannot control our emotions,
but we can control our keyboard -
إخلاء المسؤولية
لا يُقصد بالمعلومات والمنشورات أن تكون، أو تشكل، أي نصيحة مالية أو استثمارية أو تجارية أو أنواع أخرى من النصائح أو التوصيات المقدمة أو المعتمدة من TradingView. اقرأ المزيد في شروط الاستخدام.