PROTECTED SOURCE SCRIPT
💀 Death Cross - Crypto Bros
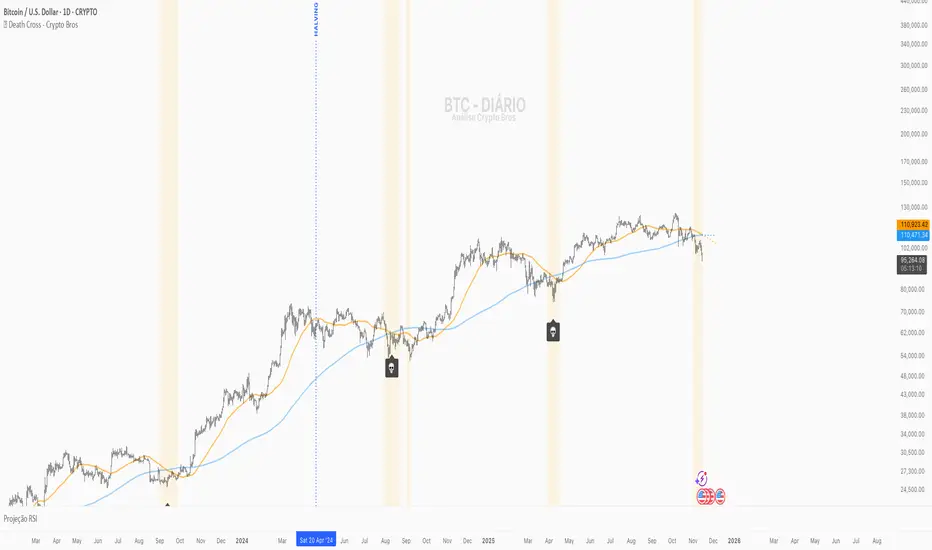
💀 Death Cross – Crypto Bros
Identify the most important crossover of BTCUSD and visualize attention zones before and after the event.
What This Indicator Does
The Death Cross – Crypto Bros indicator monitors the structural relationship between the 50-period and 200-period moving averages, using a selectable timeframe (default: 1D).
It provides three core features:
1. Death Cross Detection
The Death Cross occurs when the MA50 crosses below the MA200.
The indicator automatically displays:
- a 💀 callout below the candle
- a highlighted background
- optional alerts
2. Attention Zone (Before and After the Cross)
The indicator highlights bars where structural weakness is developing.
Before the Death Cross:
- MA50 above MA200
- MA50 pointing downward
- Distance between MAs ≤ 4% (configurable)
After the Death Cross:
- MA50 below MA200
- MA50 still pointing downward
- Distance between MAs ≤ 4%
This creates a clear visual map of structural weakness around the cross.
3. MA Projections
Dotted projection lines show the current slope and momentum of MA50 and MA200.
When to Use It
This indicator is designed for traders who want to:
- spot early macro weakness
- manage exposure near trend shifts
- avoid premature long entries
- track Bitcoin's macro structure
- combine it with other confluence tools
Key Settings
- Timeframe for MAs – default 1D
- Type of Moving Average – SMA (default) or EMA
- Attention Zone – background color + maximum MA distance (%)
- Projections – enable/disable dotted forward MAs
Alerts Available
You can enable:
- Death Cross Alert
Triggers when MA50 crosses downward through MA200.
- Attention Zone Start
Triggers when the Attention Zone becomes active for the first time.
Create one or both depending on your strategy.
How to Interpret the Visuals
- 💀 Highlighted Candle + Skull Icon
→ The Death Cross has occurred.
- 🟡 Attention Zone Before the Cross
→ MA50 is turning downward and approaching MA200.
- 🟠 Attention Zone After the Cross
→ Post-cross weakness remains elevated.
- 🔮 MA Projections
→ Show the directional momentum of MA50 and MA200.
Suggested Confluence Tools
For better accuracy, combine with:
- RSI
- OBV
- Market Structure (BOS/CHoCH)
- Volume
- Macro sentiment
About This Indicator
Created for the Crypto Bros community to deliver:
- clean macro trend visualization
- early warning signals
- smart exposure and risk management
Feedback & Improvements
If you’d like more features or enhancements, feel free to reach out!
Identify the most important crossover of
What This Indicator Does
The Death Cross – Crypto Bros indicator monitors the structural relationship between the 50-period and 200-period moving averages, using a selectable timeframe (default: 1D).
It provides three core features:
1. Death Cross Detection
The Death Cross occurs when the MA50 crosses below the MA200.
The indicator automatically displays:
- a 💀 callout below the candle
- a highlighted background
- optional alerts
2. Attention Zone (Before and After the Cross)
The indicator highlights bars where structural weakness is developing.
Before the Death Cross:
- MA50 above MA200
- MA50 pointing downward
- Distance between MAs ≤ 4% (configurable)
After the Death Cross:
- MA50 below MA200
- MA50 still pointing downward
- Distance between MAs ≤ 4%
This creates a clear visual map of structural weakness around the cross.
3. MA Projections
Dotted projection lines show the current slope and momentum of MA50 and MA200.
When to Use It
This indicator is designed for traders who want to:
- spot early macro weakness
- manage exposure near trend shifts
- avoid premature long entries
- track Bitcoin's macro structure
- combine it with other confluence tools
Key Settings
- Timeframe for MAs – default 1D
- Type of Moving Average – SMA (default) or EMA
- Attention Zone – background color + maximum MA distance (%)
- Projections – enable/disable dotted forward MAs
Alerts Available
You can enable:
- Death Cross Alert
Triggers when MA50 crosses downward through MA200.
- Attention Zone Start
Triggers when the Attention Zone becomes active for the first time.
Create one or both depending on your strategy.
How to Interpret the Visuals
- 💀 Highlighted Candle + Skull Icon
→ The Death Cross has occurred.
- 🟡 Attention Zone Before the Cross
→ MA50 is turning downward and approaching MA200.
- 🟠 Attention Zone After the Cross
→ Post-cross weakness remains elevated.
- 🔮 MA Projections
→ Show the directional momentum of MA50 and MA200.
Suggested Confluence Tools
For better accuracy, combine with:
- RSI
- OBV
- Market Structure (BOS/CHoCH)
- Volume
- Macro sentiment
About This Indicator
Created for the Crypto Bros community to deliver:
- clean macro trend visualization
- early warning signals
- smart exposure and risk management
Feedback & Improvements
If you’d like more features or enhancements, feel free to reach out!
نص برمجي محمي
تم نشر هذا النص البرمجي كمصدر مغلق. ومع ذلك، يمكنك استخدامه بحرية ودون أي قيود - تعرف على المزيد هنا.
إخلاء المسؤولية
لا يُقصد بالمعلومات والمنشورات أن تكون، أو تشكل، أي نصيحة مالية أو استثمارية أو تجارية أو أنواع أخرى من النصائح أو التوصيات المقدمة أو المعتمدة من TradingView. اقرأ المزيد في شروط الاستخدام.