OPEN-SOURCE SCRIPT
ka66: Volatility Momentum
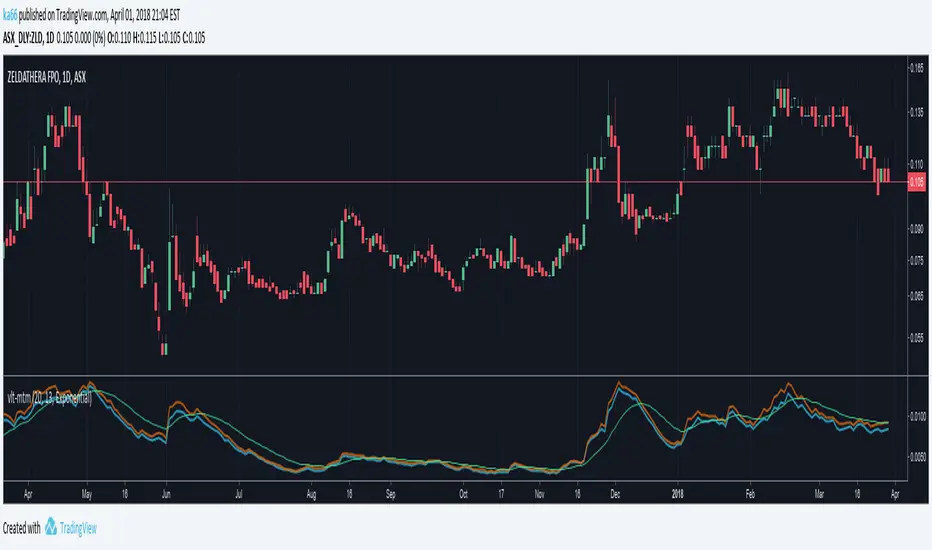
This is a 'monitoring' indicator to see if an instrument is viable enough to be traded, by virtue of volatility (or lack of volatility in context may lead to a break out), or may become so. It shows the following information:
Price Range (high - low) averaged across a set of bars: Useful gauging potential trading profits. This was its initial goal, to not measure bars manually!
ATR: As a comparison point for the price range above. Divergence between true range (TR) and plain price range might signal volatility changes occurring in the instrument.
Signal volatility line: a moving average of the larger of the average price range and ATR. This takes inspiration from other indicators like MACD and Stochastic, and is a way of comparing change in recent volatility --- this achieves the momentum part. The larger was chosen to keep things simple, and not have a signal line per range!
avgRange = movingAvg(high - low, avgPeriod)
atr = movingAvg(trueRange, avgPeriod)
signal = movingAvg(max(avgRange, atr), avgPeriod)
Configurable periods and averaging mechanism.
نص برمجي مفتوح المصدر
بروح TradingView الحقيقية، قام مبتكر هذا النص البرمجي بجعله مفتوح المصدر، بحيث يمكن للمتداولين مراجعة وظائفه والتحقق منها. شكرا للمؤلف! بينما يمكنك استخدامه مجانًا، تذكر أن إعادة نشر الكود يخضع لقواعد الموقع الخاصة بنا.
إخلاء المسؤولية
لا يُقصد بالمعلومات والمنشورات أن تكون، أو تشكل، أي نصيحة مالية أو استثمارية أو تجارية أو أنواع أخرى من النصائح أو التوصيات المقدمة أو المعتمدة من TradingView. اقرأ المزيد في شروط الاستخدام.