OPEN-SOURCE SCRIPT
Exhaustion Table [SpiritualHealer117]
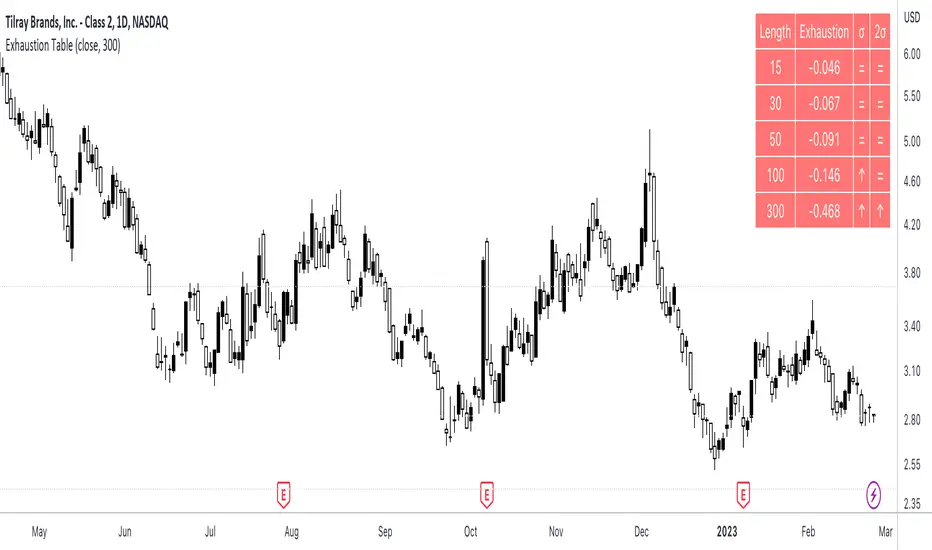
A simple indicator in a table format, is effective for determining when an individual stock or cryptocurrency is oversold or overbought.
Using the indicator
In the column "2σ", up arrows indicate that the asset is very overbought, down arrows indicate that an asset is very oversold, and an equals sign indicates that the indicator is neutral.
In the column "σ", up arrows indicate that the asset is overbought, down arrows indicate that an asset is oversold, and an equals sign indicates that the indicator is neutral.
What indicator is
The indicator shows the exhaustion (percentage gap between the closing price and a moving average) at 5 given lengths, 15, 30, 50, 100, and 300. It compares that to two thresholds for exhaustion: one standard deviation out and one two standard deviations out.
نص برمجي مفتوح المصدر
بروح TradingView الحقيقية، قام مبتكر هذا النص البرمجي بجعله مفتوح المصدر، بحيث يمكن للمتداولين مراجعة وظائفه والتحقق منها. شكرا للمؤلف! بينما يمكنك استخدامه مجانًا، تذكر أن إعادة نشر الكود يخضع لقواعد الموقع الخاصة بنا.
إخلاء المسؤولية
The information and publications are not meant to be, and do not constitute, financial, investment, trading, or other types of advice or recommendations supplied or endorsed by TradingView. Read more in the Terms of Use.