OPEN-SOURCE SCRIPT
SMA Crossover Support & Resistance [Rami_LB]
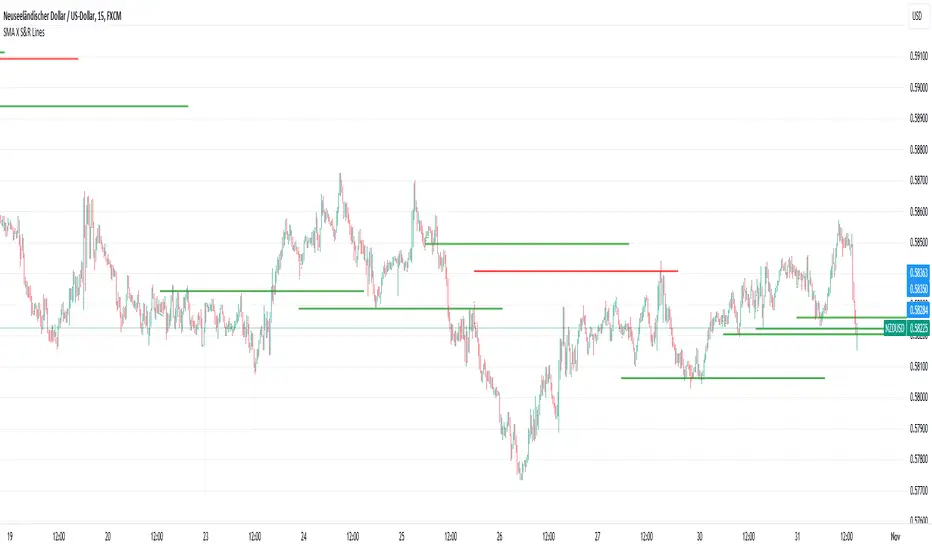
This indicator draws a horizontal line on the price chart at the point where two pre-defined SMA (Simple Moving Average) lines intersect. It is most useful for identifying crossed SMA lines on the 1-hour chart and then trading on smaller chart intervals.
For optimal performance, it is recommended to customize the values of the SMA lines individually for each currency pair, as these values can vary from one pair to another. To do this, switch to the 1-hour chart and adjust the SMA parameters until you visually observe that these settings would yield favorable results based on historical data. Certainly, you can also adjust the length of the lines accordingly when you switch from the 1-hour chart to smaller timeframes.
Please note that this indicator allows traders to visually identify potential trend changes and crossovers between short-term and long-term moving averages, aiding in decision-making for trading strategies.
نص برمجي مفتوح المصدر
بروح TradingView الحقيقية، قام مبتكر هذا النص البرمجي بجعله مفتوح المصدر، بحيث يمكن للمتداولين مراجعة وظائفه والتحقق منها. شكرا للمؤلف! بينما يمكنك استخدامه مجانًا، تذكر أن إعادة نشر الكود يخضع لقواعد الموقع الخاصة بنا.
إخلاء المسؤولية
لا يُقصد بالمعلومات والمنشورات أن تكون، أو تشكل، أي نصيحة مالية أو استثمارية أو تجارية أو أنواع أخرى من النصائح أو التوصيات المقدمة أو المعتمدة من TradingView. اقرأ المزيد في شروط الاستخدام.