OPEN-SOURCE SCRIPT
12 Weeks of Weekly Levels
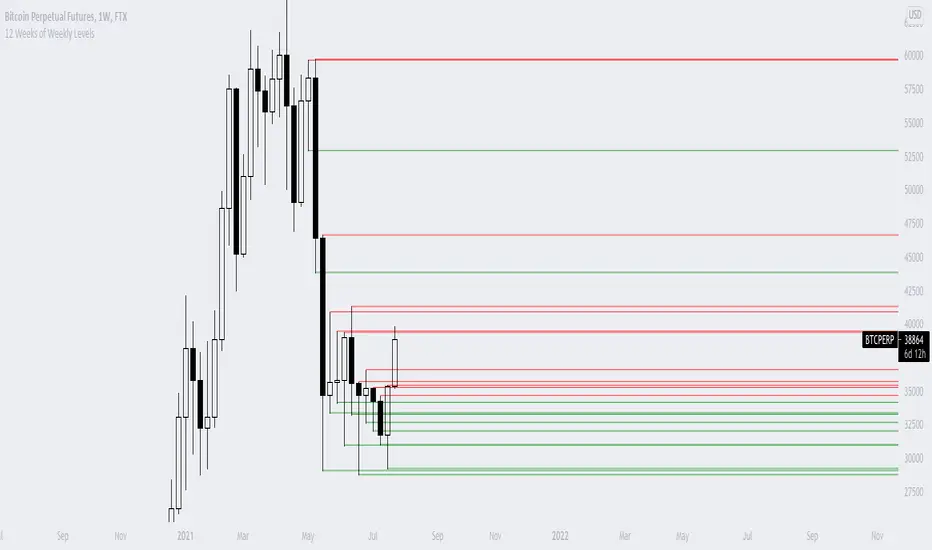
A very simple indicator, which basically looks back on the past 12 weeks at 8PM EST and finds the highs and the lows. Once it finds those levels, it draws them as horizontal rays on the chart. The lows are drawn in green (to indicate previous buy zones) and the highs in red (to indicate previous sell zones). No user inputs are required
Nothing fancy, just weekly levels for the past quarter. You can easily draw these on a chart yourself, but it becomes very time consuming if you are watching a bunch of instruments and then Sundays come around.
Special shoutout to rumpypumpydumpy on StackOverflow for helping me work out the kinks, this is the first indicator I ever created. Hope it helps you find confluence in your decision making
نص برمجي مفتوح المصدر
بروح TradingView الحقيقية، قام مبتكر هذا النص البرمجي بجعله مفتوح المصدر، بحيث يمكن للمتداولين مراجعة وظائفه والتحقق منها. شكرا للمؤلف! بينما يمكنك استخدامه مجانًا، تذكر أن إعادة نشر الكود يخضع لقواعد الموقع الخاصة بنا.
إخلاء المسؤولية
لا يُقصد بالمعلومات والمنشورات أن تكون، أو تشكل، أي نصيحة مالية أو استثمارية أو تجارية أو أنواع أخرى من النصائح أو التوصيات المقدمة أو المعتمدة من TradingView. اقرأ المزيد في شروط الاستخدام.