PROTECTED SOURCE SCRIPT
RSI-based strategy for MATIC on 3commas - uses a 15m chart
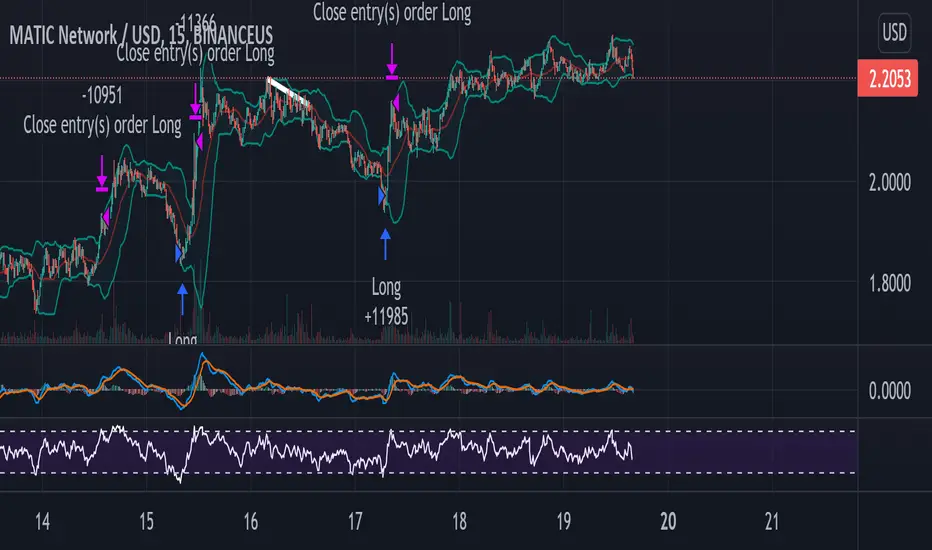
I looked all over TradingView and could not find a script that specifically does this so I wrote one. It's not complicated but it works pretty well. Essentially the concept is that you specify two RSI values: a buying threshold and selling threshold. The indicator will make buys based on RSI crossing your buy threshold and sells based on it crossing your sell threshold.
You can change the actual RSI parameters though I have found it works best with the default settings I have listed. It is set for a 15m MATIC chart but you can use it with anything on any time period but you will need to modify the thresholds and check the backtester if you use it on anything other than a 15m MATIC chart.
There is also a date range selector so you can test it over a specific time period. I typically use the past 1-2 months to get a good feel for if the settings I have picked work well in current market conditions.
It also functions as a regular RSI indicator so if you use this you probably don't need to apply any other RSI indicators to your chart.
I have made the indicator usable so that you can test it out manually to verify that it works as expected and if you want access to the script itself (to enable automated trading on 3commas) please message me and we can work something out.
In the future I might add some extra settings to this like a smoothed EMA so you can make more discerning buys, it depends on how many people contact me for the full script.
نص برمجي محمي
تم نشر هذا النص البرمجي كمصدر مغلق. ومع ذلك، يمكنك استخدامه بحرية ودون أي قيود - تعرف على المزيد هنا.
إخلاء المسؤولية
لا يُقصد بالمعلومات والمنشورات أن تكون، أو تشكل، أي نصيحة مالية أو استثمارية أو تجارية أو أنواع أخرى من النصائح أو التوصيات المقدمة أو المعتمدة من TradingView. اقرأ المزيد في شروط الاستخدام.