OPEN-SOURCE SCRIPT
Previous_DWMQY_High/Low & Pivots
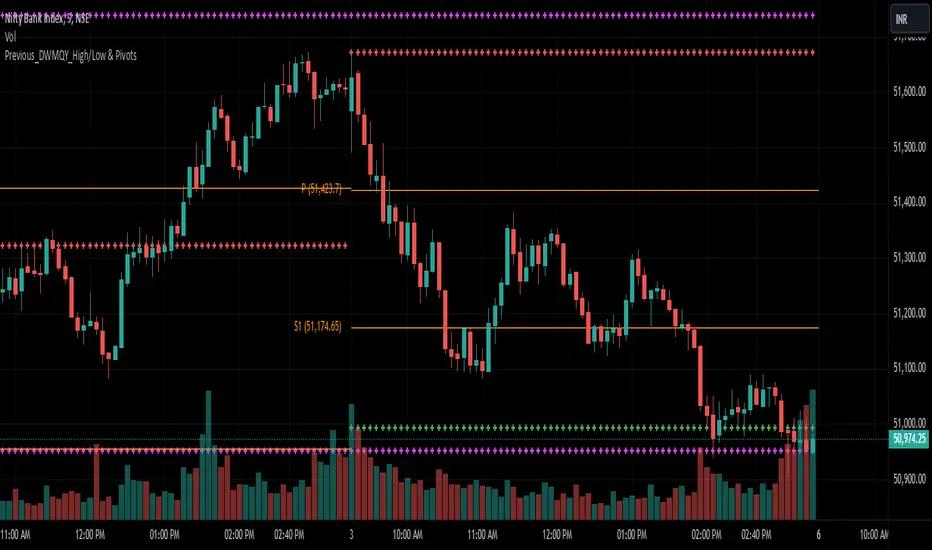
This script calculates high/low pivots for different timeframes (daily, weekly, monthly, quarterly, and yearly). You have various pivot point calculation methods (Traditional, Fibonacci, Woodie, Classic, DM, Camarilla) and have inputs that allow customization of the indicator. The script also accounts for custom year-based calculations (bi-yearly, tri-yearly, quinquennially, decennially).
The first part of your code calculates the high and low levels for different timeframes, which are plotted on the chart as crosses. The second part involves the pivot point calculations, where the user selects the type of pivot point calculation (Traditional, Fibonacci, etc.), the timeframe for pivots, and other display settings.
The first part of your code calculates the high and low levels for different timeframes, which are plotted on the chart as crosses. The second part involves the pivot point calculations, where the user selects the type of pivot point calculation (Traditional, Fibonacci, etc.), the timeframe for pivots, and other display settings.
نص برمجي مفتوح المصدر
بروح TradingView الحقيقية، قام مبتكر هذا النص البرمجي بجعله مفتوح المصدر، بحيث يمكن للمتداولين مراجعة وظائفه والتحقق منها. شكرا للمؤلف! بينما يمكنك استخدامه مجانًا، تذكر أن إعادة نشر الكود يخضع لقواعد الموقع الخاصة بنا.
إخلاء المسؤولية
لا يُقصد بالمعلومات والمنشورات أن تكون، أو تشكل، أي نصيحة مالية أو استثمارية أو تجارية أو أنواع أخرى من النصائح أو التوصيات المقدمة أو المعتمدة من TradingView. اقرأ المزيد في شروط الاستخدام.