OPEN-SOURCE SCRIPT
تم تحديثه Trend Following Moron TFM 10% System
Trend Following Moron TFM 10% System
The TFM 10% Market Timing System
The Trend Following Moron TFM 10% System is a powerful trading tool designed using Pine Script™, following the principles outlined by Dave S. Landry. This script helps traders identify optimal entry and exit points based on moving averages and market trends.
What the Script Does:
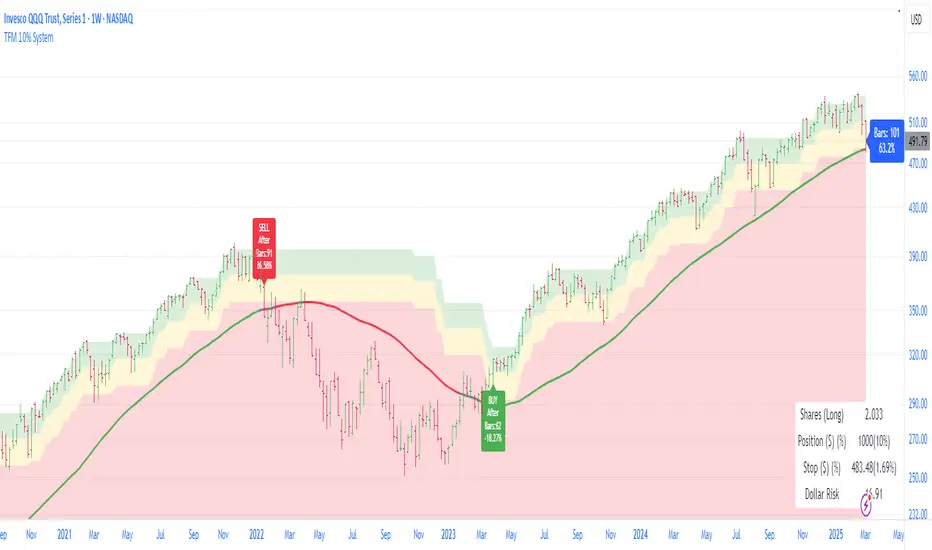
Visual representation of trend strength.
As long as it is trending in green band, trend is very strong and price is contained within 5% of the high.
As price drops to yellow band, strength is weakening and caution is advised. Price is between 5% to 10% away from52 week high.
As price drops in red band, it is to be avoided as trend is rolling over. Price is more than 10% way from 52 week high.
Moving Averages Calculation:
Users can choose between Simple Moving Average (SMA) and Exponential Moving Average (EMA) for daily, weekly, and monthly periods. The script calculates the moving averages to provide trend direction.
Trend Color Coding:
Moving averages are displayed in different colors based on market conditions: green indicates an uptrend, red for a downtrend, and gray for neutral conditions.
Highs Calculation:
The script calculates the 52-week and 12-month closing highs, which are crucial for identifying potential breakout points.
Level Definition:
Traders can set levels based on either Average True Range (ATR) or percentage changes from these highs, allowing for flexible risk management strategies.
Buy and Sell Conditions:
The script defines specific buy conditions: when the price is within 10% of the highest close and trading above the moving averages, and sell conditions: when the price falls below these thresholds.
Visual Indicators:
Buy and sell signals are visually represented on the chart with arrows, making it easy for traders to see potential trading opportunities at a glance.
Performance Labels:
The script includes performance labels that track the number of bars above or below the moving averages and the percentage change from the moving average, providing users with key metrics to evaluate their trades.
Interactive Table:
A table summarizing the buy and sell rules is displayed on the chart, ensuring that traders have quick access to the system’s trading logic.
Benefits of Using the TFM 10% System:
Streamlined Decision Making:
The script simplifies the trading process by clearly outlining buy and sell signals, making it accessible even for novice traders.
Customizable Parameters:
Users can tailor the script to their preferences by adjusting moving average types and lengths, ATR levels, and percentage thresholds. Bands are interchange able for ATR and Percent below 52 week high for volatility looks. But buy and sell are fixed in 10% threshold.
Risk Management:
By utilizing ATR and percentage levels, traders can effectively manage their risk, making the trading process more systematic.
Comprehensive Market Analysis:
The combination of multiple time frames (daily, weekly, monthly) allows for a well-rounded analysis of market trends, enhancing trading accuracy.
ملاحظات الأخبار
https://www.tradingview.com/x/H7AHCLOM/1.Introduced Groups for user inputs
2.Added Tooltips
3.Lookback period for daily, weekly and monthly highs has been linked to moving average inputs to make these dynamic to user input
4.Rearrange ATR Inputs align with input groups
5.Buy and sell signals are now dynamic with user input at moving average and distance from highest high.
6.Based on the input from David S Landry on this Trend Following Moron TFM 10% System ,buy and sell label has been updated to show only one buy and one sell signal.
7.User can use this indicator to study the trend on daily , weekly and monthly chart.
8.David S Landry uses it for weekly chart and 50 week closing high , 50 week moving average 10% distance for buy and sell signal.
ملاحظات الأخبار
https://www.tradingview.com/x/B4yZ79Fh/1. Update on sell condition, when moving average is above the level2 -10% area from high then close below the moving average is the sell signal without close below level 2 - 10%.
2. When moving average is below the level2 10% then sell signal is close below both level2 10% as well as close below moving average.
ملاحظات الأخبار
1. Sell logic fixed https://www.tradingview.com/x/OcKIV1wG/
ملاحظات الأخبار
Update on Labels
Buy Label displays buy signal after how many bars and percentage change from last sell signal
Sell Label display sell signal after how many bars and percentage change from last buy signal
This is helpful to quickly glance the length and strength of last signal
This can be used for market cycle count, just remember we are using two lows above the moving average for buy signal.
ملاحظات الأخبار
Buy and Sell logic fixed.ملاحظات الأخبار
Added Option to display stats for current signal which user can toggle on off and it is different from moving average label which is Landry Light or Dave Light or Daylight stats. It is helpful for current up or down market cycleملاحظات الأخبار
Since this system defines buy and sell signal, to complete it we now have position size calculator built in this indicator.
Enter you account size
Enter Maximum position size
Enter Maximum Risk per trade as percent of account size
Stop loss is based on trend following moving average (daily or weekly or monthly what you are using in TFM 10% System)
Dark and light mode for different back ground
Position of table can be adjusted
Option to display or not display the position size table
This Position size table will give
Share to buy long or short based on signal buy or sell
Position size in $ value and % of account
Stop loss value and % stop distance from current price
Dollar risk $
Why is this important, below is reminder
Ed Seykota:
Entry: "You must have a strong reason for entering a trade. Your entry point should be based on solid analysis, not hope."
Exit: "The exit is more important than the entry. You can enter a trade many times, but if you don’t have a clear exit strategy, you will lose money."
Richard Dennis:
Entry: "Be prepared to change your opinion about the market. If you see something different, don’t hesitate to act."
Exit: "The market will tell you when it’s time to exit. Listen to it."
David Ryan:
"Never risk more than 1-2% of your trading capital on a single trade. This ensures you can stay in the game long-term."
Mark Minervini:
"I typically have no more than five to seven positions at one time. This allows me to focus on each trade and make informed decisions."
Van K. Tharp:
"Your total risk on all open positions should never exceed 10% of your total trading capital. This ensures you can withstand drawdowns without significant damage."
Ed Seykota:
"The key to survival in trading is managing your total risk. If you don’t have a clear understanding of how much you’re risking across all positions, you’re setting yourself up for disaster."
ملاحظات الأخبار
Update on logic to show or hide position size table.ملاحظات الأخبار
Added Pine screener option for screeningUse from Plot active buy or sell signal above 0 and bars since active signal in columns with sort from low to high
نص برمجي مفتوح المصدر
بروح TradingView الحقيقية، قام مبتكر هذا النص البرمجي بجعله مفتوح المصدر، بحيث يمكن للمتداولين مراجعة وظائفه والتحقق منها. شكرا للمؤلف! بينما يمكنك استخدامه مجانًا، تذكر أن إعادة نشر الكود يخضع لقواعد الموقع الخاصة بنا.
إخلاء المسؤولية
لا يُقصد بالمعلومات والمنشورات أن تكون، أو تشكل، أي نصيحة مالية أو استثمارية أو تجارية أو أنواع أخرى من النصائح أو التوصيات المقدمة أو المعتمدة من TradingView. اقرأ المزيد في شروط الاستخدام.