Pine Execution MapPine Script Execution Map
Overview:
This is an educational script for Pine Script developers. The script includes data structure, functions/methods, and process to capture and print Pine Script execution map of functions called while pine script execution.
Map of execution is produced for last/latest candle execution.
The script also has example code to call execution map methods and generate Pine Execution map.
Use cases:
Pine script developers can get view of how the functions are called
This can also be used while debugging the code and know which functions are called vs what developer expect code to do
One can use this while using any of the open source published script and understand how public script is organized and how functions of the script are called.
Code components:
User defined type
type EMAP
string group
string sub_group
int level
array emap = array.new()
method called internally by other methods to generate level of function being executed
method id(string tag) =>
if(str.startswith(tag, "MAIN"))
exe_level.set(0, 0)
else if(str.startswith(tag, "END"))
exe_level.set(0, exe_level.get(0) - 1)
else
exe_level.set(0, exe_level.get(0) + 1)
exe_level.get(0)
Method called from main/global scope to record execution of main scope code. There should be only one call to this method at the start of global scope.
method main(string tag) =>
this = EMAP.new()
this.group := "MAIN"
this.sub_group := tag
this.level := "MAIN".id()
emap.push(this)
Method called from main/global scope to record end of execution of main scope code. There should be only one call to this method at the end of global scope.
method end_main(string tag) =>
this = EMAP.new()
this.group := "END_MAIN"
this.sub_group := tag
this.level := 0
emap.push(this)
Method called from start of each function to record execution of function code
method call(string tag) =>
this = EMAP.new()
this.group := "SUB"
this.sub_group := tag
this.level := "SUB".id()
emap.push(this)
Method called from end of each function to record end of execution of function code
method end_call(string tag) =>
this = EMAP.new()
this.group := "END_SUB"
this.sub_group := tag
this.level := "END_SUB".id()
emap.push(this)
Pine code which generates execution map and show it as a label tooltip.
if(barstate.islast)
for rec in emap
if(not str.startswith(rec.group, "END"))
lvl_tab = str.repeat("", rec.level+1, "\t")
txt = str.format("=> {0} {1}> {2}", lvl_tab, rec.level, rec.sub_group)
debug.log(txt)
debug.lastr()
Snapshot 1:
This is the output of the script and can be viewed by hovering mouse pointer over the blue color diamond shaped label
Snapshot 2:
How to read the Pine execution map
Educational

Engulfing Pattern with Multiple EMAs and AlertsCreated in copilot for pine script for bullish and bearish engulfing where the signal appears if the engulfing candle closed above or below the 14ema and it must close with the ema passing through either the wick or the candle body, also another stipulation the engulfing candle must be at least a min of 2x the size of the previous candle. The AI created this already adding the 14 ema so I added the 50 and 200 Emas as extras


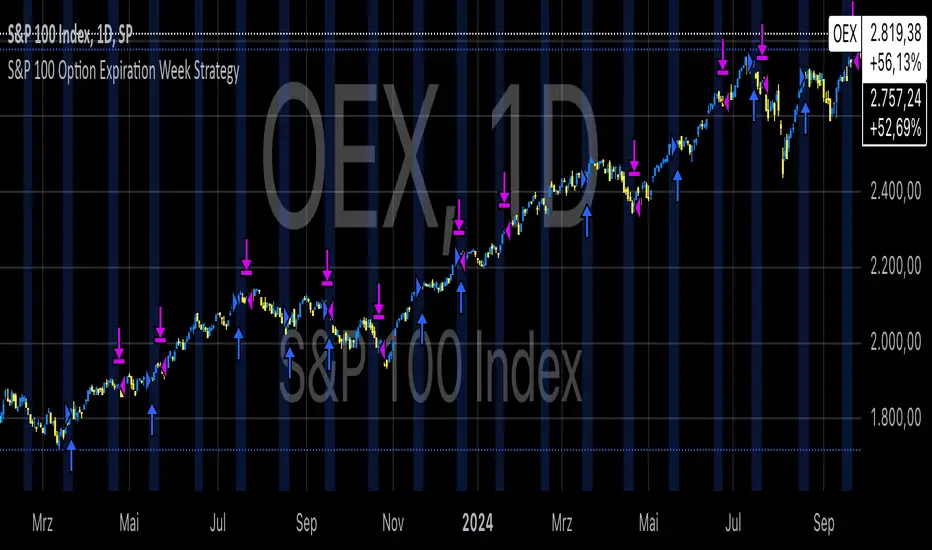
S&P 100 Option Expiration Week StrategyThe Option Expiration Week Strategy aims to capitalize on increased volatility and trading volume that often occur during the week leading up to the expiration of options on stocks in the S&P 100 index. This period, known as the option expiration week, culminates on the third Friday of each month when stock options typically expire in the U.S. During this week, investors in this strategy take a long position in S&P 100 stocks or an equivalent ETF from the Monday preceding the third Friday, holding until Friday. The strategy capitalizes on potential upward price pressures caused by increased option-related trading activity, rebalancing, and hedging practices.
The phenomenon leveraged by this strategy is well-documented in finance literature. Studies demonstrate that options expiration dates have a significant impact on stock returns, trading volume, and volatility. This effect is driven by various market dynamics, including portfolio rebalancing, delta hedging by option market makers, and the unwinding of positions by institutional investors (Stoll & Whaley, 1987; Ni, Pearson, & Poteshman, 2005). These market activities intensify near option expiration, causing price adjustments that may create short-term profitable opportunities for those aware of these patterns (Roll, Schwartz, & Subrahmanyam, 2009).
The paper by Johnson and So (2013), Returns and Option Activity over the Option-Expiration Week for S&P 100 Stocks, provides empirical evidence supporting this strategy. The study analyzes the impact of option expiration on S&P 100 stocks, showing that these stocks tend to exhibit abnormal returns and increased volume during the expiration week. The authors attribute these patterns to intensified option trading activity, where demand for hedging and arbitrage around options expiration causes temporary price adjustments.
Scientific Explanation
Research has found that option expiration weeks are marked by predictable increases in stock returns and volatility, largely due to the role of options market makers and institutional investors. Option market makers often use delta hedging to manage exposure, which requires frequent buying or selling of the underlying stock to maintain a hedged position. As expiration approaches, their activity can amplify price fluctuations. Additionally, institutional investors often roll over or unwind positions during expiration weeks, creating further demand for underlying stocks (Stoll & Whaley, 1987). This increased demand around expiration week typically leads to temporary stock price increases, offering profitable opportunities for short-term strategies.
Key Research and Bibliography
Johnson, T. C., & So, E. C. (2013). Returns and Option Activity over the Option-Expiration Week for S&P 100 Stocks. Journal of Banking and Finance, 37(11), 4226-4240.
This study specifically examines the S&P 100 stocks and demonstrates that option expiration weeks are associated with abnormal returns and trading volume due to increased activity in the options market.
Stoll, H. R., & Whaley, R. E. (1987). Program Trading and Expiration-Day Effects. Financial Analysts Journal, 43(2), 16-28.
Stoll and Whaley analyze how program trading and portfolio insurance strategies around expiration days impact stock prices, leading to temporary volatility and increased trading volume.
Ni, S. X., Pearson, N. D., & Poteshman, A. M. (2005). Stock Price Clustering on Option Expiration Dates. Journal of Financial Economics, 78(1), 49-87.
This paper investigates how option expiration dates affect stock price clustering and volume, driven by delta hedging and other option-related trading activities.
Roll, R., Schwartz, E., & Subrahmanyam, A. (2009). Options Trading Activity and Firm Valuation. Journal of Financial Markets, 12(3), 519-534.
The authors explore how options trading activity influences firm valuation, finding that higher options volume around expiration dates can lead to temporary price movements in underlying stocks.
Cao, C., & Wei, J. (2010). Option Market Liquidity and Stock Return Volatility. Journal of Financial and Quantitative Analysis, 45(2), 481-507.
This study examines the relationship between options market liquidity and stock return volatility, finding that increased liquidity needs during expiration weeks can heighten volatility, impacting stock returns.
Summary
The Option Expiration Week Strategy utilizes well-researched financial market phenomena related to option expiration. By positioning long in S&P 100 stocks or ETFs during this period, traders can potentially capture abnormal returns driven by option market dynamics. The literature suggests that options-related activities—such as delta hedging, position rollovers, and portfolio adjustments—intensify demand for underlying assets, creating short-term profit opportunities around these key dates.
SMA- Ashish SinghSMA
This script implements a Simple Moving Average (SMA) crossover strategy using three SMAs: 200-day, 50-day, and 20-day, with buy and sell signals triggered based on specific conditions involving these moving averages. The indicator is overlaid on the price chart, providing visual cues for potential buy and sell opportunities based on moving average crossovers.
Key Features:
Moving Averages:
The 200-day, 50-day, and 20-day SMAs are calculated and plotted on the price chart. These are key levels that traders use to assess trends.
The 200-day SMA represents the long-term trend, the 50-day SMA is used for medium-term trends, and the 20-day SMA is for short-term analysis.
Buy Signal:
A buy signal is triggered when the price is below all three moving averages (200 SMA, 50 SMA, 20 SMA) and the SMAs are in a specific downward trend (200 SMA > 50 SMA > 20 SMA). This is an indication of a potential upward reversal.
The buy signal is marked with a green triangle below the price bar.
Sell Signal:
A sell signal is triggered when the price is above all three moving averages and the SMAs are in a specific upward trend (200 SMA < 50 SMA < 20 SMA). This signals a potential downward reversal.
The sell signal is marked with a red triangle above the price bar.
Trade Information:
After a buy signal, the buy price, bar index, and timestamp are recorded. When a sell signal occurs, the percentage gain or loss is calculated along with the number of days between the buy and sell signals.
The script automatically displays a label on the chart showing the gain or loss percentage along with the number of days the trade lasted. Green labels represent gains, and red labels represent losses.
User-friendly Visuals:
The buy and sell signals are plotted as small triangles directly on the chart for easy identification.
Detailed trade information is provided with well-formatted labels to highlight the profit or loss after each trade.
How It Works:
This strategy helps traders to identify trend reversals by leveraging long-term and short-term moving averages.
A single buy or sell signal is triggered based on price movement relative to the SMAs and their order.
The tool is designed to help traders quickly spot buying and selling opportunities with clear visual indicators and gain/loss metrics.
This indicator is ideal for traders looking to implement a systematic SMA-based strategy with well-defined buy/sell points and automatic performance tracking for each trade.
Disclaimer: The information provided here is for educational and informational purposes only. It is not intended as financial advice or as a recommendation to buy or sell any stocks. Please conduct your own research or consult a financial advisor before making any investment decisions. ProfitLens does not guarantee the accuracy, completeness, or reliability of any information presented.

9497707056 Ema 5 and 15-Minute Signal5 EMA
A 5-period EMA is a dynamic line on a trading chart that's highly responsive to recent price movements. The 5 EMA scalping strategy looks for reversals when the price moves away from the 5 EMA, which is considered the mean point of the price.
15 EMA
A 15 EMA is used in conjunction with the 5 EMA to identify bullish crossovers. A bullish crossover occurs when the 5 EMA crosses above the 15 EMA.

20-40 SMA Crossover with Buy/Sell ArrowsThis script is designed to help traders visually identify potential entry and exit points based on the crossover of two Simple Moving Averages (SMA) — the 20-period and 40-period SMAs. By using these widely followed moving averages, this indicator highlights possible buy and sell opportunities in line with the trend.
How It Works
20 SMA (Short-term) and 40 SMA (Mid-term): The 20-period SMA is a short-term moving average, while the 40-period SMA is a mid-term average. The crossover of these SMAs provides insights into potential trend shifts.
Crossover & Crossunder Signals:
A Buy Signal is generated when the 20 SMA crosses above the 40 SMA, signaling upward momentum and potential entry points. Green arrows labeled "BUY" mark these points below the price bars.
A Sell Signal is triggered when the 20 SMA crosses below the 40 SMA, indicating possible downward momentum and exit points. Red arrows labeled "SELL" are shown above the price bars.
Key Features
Visual Clarity: Green and red arrows mark buy and sell points on the chart, making it easy to spot opportunities at a glance.
Overlay on Price Chart: The script overlays the 20 SMA and 40 SMA directly on the chart, offering a clear view of price in relation to these averages.
Customizable for Multiple Timeframes: This indicator can be applied to various timeframes, adapting to different trading styles.
Ideal for
Trend Traders looking to capture the momentum of the market.
Beginner and Intermediate Traders who need a simple and effective trend-following strategy.
Note: This indicator is best used in trending markets and should be combined with additional analysis and risk management techniques for effective trading decisions.

Strategy Guide | XEONEDIAStrategy Guide | XEONEDIA is a digital checklist of well-known trading strategies, it does not show anything in the chart but only a customized checklist per strategy of priorities can be processed, this indicator is a comprehensive trading indicator that serves as a digital checklist, supporting traders in the preparation and execution of their trading strategies. The indicator is ideal for beginners and advanced traders who value clear structure and precise steps for each trading method.
Why Strategy Guide | XEONEDIA?
🎨 User-friendly design, perfect for beginners and advanced traders
🌐 Multi-language options, including 🇩🇪, 🇬🇧, 🇫🇷, and 🇱🇺.
⚙️ Customizable checklist for every strategy
📲 Easy integration and access on all TradingView devices
Features of Strategy Guide | XEONEDIA:
Strategy Documentation and Analysis
📋 Define a clear trading strategy
🔄 Conduct backtests and analyze results
🎯 Set realistic goals and reflect on the success rate
✍️ Document key insights to regularly refine the strategy
Risk Management
💼 Set clear risk limits (1-2% per trade)
🚨 Use stop-loss orders to protect against significant losses
⚖️ Ensure at least a 2:1 risk-reward ratio
📝 Adjust position sizes according to market conditions
Technical Analysis
📊 Analyze charts and market indicators for trading signals
🔎 Identify support and resistance levels
📈 Utilize indicators like RSI and moving averages
📍 Set entry and exit points for strategic decisions
📲 Create alerts for important market conditions
Market Conditions
🌍 Consider external factors and economic data
📆 Monitor the economic calendar and relevant news
📰 Conduct fundamental analysis to identify trends
📉 Observe market volatility and global events
💡 Adjust the strategy when significant market changes occur
Psychological Management
🧠 Control emotions and avoid impulsive actions
📑 Strictly adhere to the trading plan
🛠 Set realistic expectations and learn from each trade
🌱 Take regular mental breaks to manage stress
💬 Reflect on your trading and note insights for future decisions
✅ Mastercheck Feature
The Mastercheck feature allows you to check off all points directly in the TradingView interface, efficiently organizing your trading preparation. This feature ensures that you have access to your checklist entries anywhere, anytime, and can make real-time adjustments.
Strategy Guide | XEONEDIA simplifies the complex world of trading by helping you approach it systematically and focused, enabling you to pursue your goals efficiently and with mindful risk management.

Payday Anomaly StrategyThe "Payday Effect" refers to a predictable anomaly in financial markets where stock returns exhibit significant fluctuations around specific pay periods. Typically, these are associated with the beginning, middle, or end of the month when many investors receive wages and salaries. This influx of funds, often directed automatically into retirement accounts or investment portfolios (such as 401(k) plans in the United States), temporarily increases the demand for equities. This phenomenon has been linked to a cycle where stock prices rise disproportionately on and around payday periods due to increased buy-side liquidity.
Academic research on the payday effect suggests that this pattern is tied to systematic cash flows into financial markets, primarily driven by employee retirement and savings plans. The regularity of these cash infusions creates a calendar-based pattern that can be exploited in trading strategies. Studies show that returns on days around typical payroll dates tend to be above average, and this pattern remains observable across various time periods and regions.
The rationale behind the payday effect is rooted in the behavioral tendencies of investors, specifically the automatic reinvestment mechanisms used in retirement funds, which align with monthly or semi-monthly salary payments. This regular injection of funds can cause market microstructure effects where stock prices temporarily increase, only to stabilize or reverse after the funds have been invested. Consequently, the payday effect provides traders with a potentially profitable opportunity by predicting these inflows.
Scientific Bibliography on the Payday Effect
Ma, A., & Pratt, W. R. (2017). Payday Anomaly: The Market Impact of Semi-Monthly Pay Periods. Social Science Research Network (SSRN).
This study provides a comprehensive analysis of the payday effect, exploring how returns tend to peak around payroll periods due to semi-monthly cash flows. The paper discusses how systematic inflows impact returns, leading to predictable stock performance patterns on specific days of the month.
Lakonishok, J., & Smidt, S. (1988). Are Seasonal Anomalies Real? A Ninety-Year Perspective. The Review of Financial Studies, 1(4), 403-425.
This foundational study explores calendar anomalies, including the payday effect. By examining data over nearly a century, the authors establish a framework for understanding seasonal and monthly patterns in stock returns, which provides historical support for the payday effect.
Owen, S., & Rabinovitch, R. (1983). On the Predictability of Common Stock Returns: A Step Beyond the Random Walk Hypothesis. Journal of Business Finance & Accounting, 10(3), 379-396.
This paper investigates predictability in stock returns beyond random fluctuations. It considers payday effects among various calendar anomalies, arguing that certain dates yield predictable returns due to regular cash inflows.
Loughran, T., & Schultz, P. (2005). Liquidity: Urban versus Rural Firms. Journal of Financial Economics, 78(2), 341-374.
While primarily focused on liquidity, this study provides insight into how cash flows, such as those from semi-monthly paychecks, influence liquidity levels and consequently impact stock prices around predictable pay dates.
Ariel, R. A. (1990). High Stock Returns Before Holidays: Existence and Evidence on Possible Causes. The Journal of Finance, 45(5), 1611-1626.
Ariel’s work highlights stock return patterns tied to certain dates, including paydays. Although the study focuses on pre-holiday returns, it suggests broader implications of predictable investment timing, reinforcing the calendar-based effects seen with payday anomalies.
Summary
Research on the payday effect highlights a repeating pattern in stock market returns driven by scheduled payroll investments. This cyclical increase in stock demand aligns with behavioral finance insights and market microstructure theories, offering a valuable basis for trading strategies focused on the beginning, middle, and end of each month.

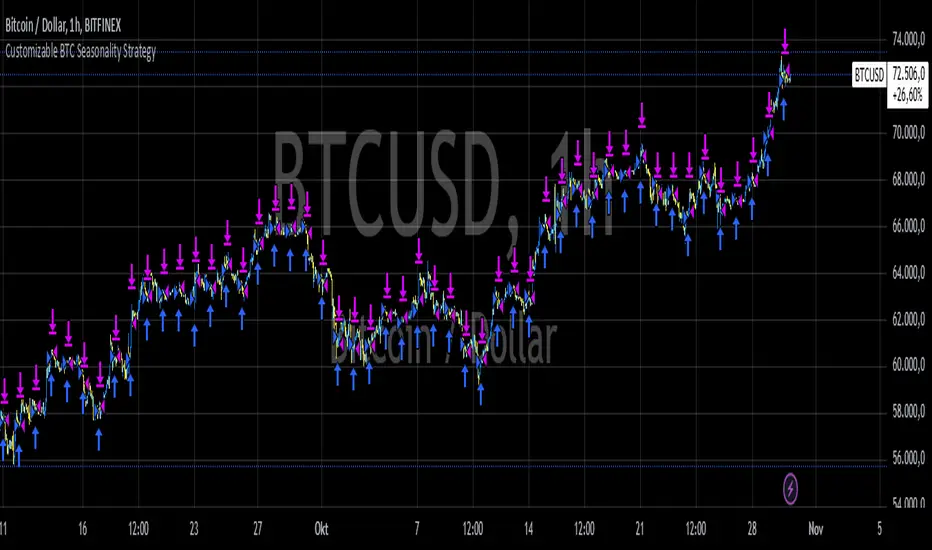
Customizable BTC Seasonality StrategyThis strategy leverages intraday seasonality effects in Bitcoin, specifically targeting hours of statistically significant returns during periods when traditional financial markets are closed. Padysak and Vojtko (2022) demonstrate that Bitcoin exhibits higher-than-average returns from 21:00 UTC to 23:00 UTC, a period in which all major global exchanges, such as the New York Stock Exchange (NYSE), Tokyo Stock Exchange, and London Stock Exchange, are closed. The absence of competing trading activity from traditional markets during these hours appears to contribute to these statistically significant returns.
The strategy proceeds as follows:
Entry Time: A long position in Bitcoin is opened at a user-specified time, which defaults to 21:00 UTC, aligning with the beginning of the identified high-return window.
Holding Period: The position is held for two hours, capturing the positive returns typically observed during this period.
Exit Time: The position is closed at a user-defined time, defaulting to 23:00 UTC, allowing the strategy to exit as the favorable period concludes.
This simple seasonality strategy aims to achieve a 33% annualized return with a notably reduced volatility of 20.93% and maximum drawdown of -22.45%. The results suggest that investing only during these high-return hours is more stable and less risky than a passive holding strategy (Padysak & Vojtko, 2022).
References
Padysak, M., & Vojtko, R. (2022). Seasonality, Trend-following, and Mean reversion in Bitcoin.
9497707056 Golden CrossoverDay traders close positions within the same day, while swing traders hold overnight or for several days to weeks for potential profits. Are swing traders more successful? The success of swing traders depends on various factors, including their strategy, risk management, and market conditions.

Relative Strength - BTM7This is an update to the Relative Strength indicator created by modhelius, as it takes by default BATS:VT as the comparative symbol and it doesn't change to AMEX:VT when choosing.

Immediate Rebalance ICT [TradingFinder] No Imbalances - MTF Gaps🔵 Introduction
The concept of "Immediate Rebalance" in technical analysis is a powerful and advanced strategy within the ICT (Inner Circle Trader) framework, widely used to identify key market levels.
Unlike the "Fair Value Gap," which leaves a price gap requiring a retracement for a fill, an Immediate Rebalance fills the gap immediately, representing an instant balance that strengthens the prevailing market trend. This structure allows traders to quickly spot critical price zones, capitalizing on strong trend continuations without the need for price retracement.
The "Immediate Rebalance ICT" indicator leverages this concept, providing traders with automated identification of critical supply and demand zones, order blocks, liquidity voids, and key buy-side and sell-side liquidity levels.
Through features like crucial liquidity points and immediate rebalancing areas, this tool enables traders to perform precise real-time market analysis and seize profitable opportunities.
🔵 How to Use
The Immediate Rebalance indicator assists traders in identifying reliable trading signals by detecting and analyzing Immediate Rebalance zones. By focusing on supply and demand areas, the indicator pinpoints optimal entry and exit positions.
Here’s how to use the indicator in both bearish (Supply Immediate Rebalance) and bullish (Demand Immediate Rebalance) structures :
🟣 Bullish Structure (Demand Immediate Rebalance)
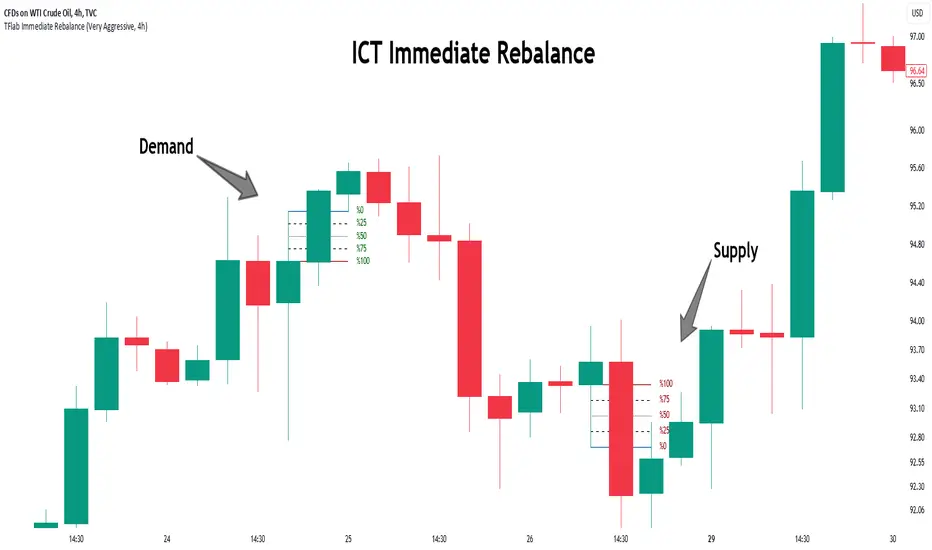
In a bullish scenario, the indicator detects a Demand Immediate Rebalance formed by two consecutive bullish candles with overlapping wicks. This structure signifies an immediate demand zone, where price instantly balances within the zone, reducing the likelihood of a revisit and indicating potential upside momentum.
Zone Identification : Look for two consecutive bullish candles with overlapping wicks, forming a demand zone. This structure, due to its rapid balance, usually does not require a revisit and supports further upward movement.
Entry and Exit Levels : If price revisits this zone, percentage markers, particularly 50% and 75%, act as supportive levels, creating ideal entry points for long positions.
Example : In the second image, an example of a Demand Immediate Rebalance is shown, where overlapping bullish candle shadows indicate immediate balance, supporting the continuation of the bullish trend.
🟣 Bearish Structure (Supply Immediate Rebalance)
In a bearish setup, the indicator identifies a Supply Immediate Rebalance when two consecutive bearish candles with overlapping wicks appear. This formation signals an immediate supply zone, suggesting a high probability of trend continuation to the downside, with minimal expectation for price to retrace back to this area.
Zone Identificatio n: Look for two consecutive bearish candles with overlapping shadows. This structure forms a supply area where price is expected to continue its downtrend without revisiting the zone.
Entry and Exit Level s: Should price revisit this zone, percentage-based levels (e.g., 50% and 75%) serve as potential resistance points, optimizing entry for short positions, especially if the downtrend is expected to persist.
Example : The attached chart illustrates a Supply Immediate Rebalance, where overlapping candle shadows define this area, reassuring traders of a continued downward trend with a low likelihood of price returning to this zone.
🔵 Settings
ImmR Filter : This filter allows users to adjust the detection of Immediate Rebalance zones in four modes, from "Very Aggressive" to "Very Defensive," based on zone width. The chosen mode controls the sensitivity of Immediate Rebalance detection, allowing users to fine-tune the indicator to their trading style.
Multi Time Frame : Enabling this option allows users to set the indicator to a specific timeframe (1 minute, 5 minutes, 15 minutes, 30 minutes, 1 hour, 4 hours, daily, weekly, or monthly), broadening the perspective for identifying Immediate Rebalance zones across multiple timeframes.
🔵 Conclusion
The Immediate Rebalance indicator, based on rapid balancing zones within supply and demand areas, serves as a powerful tool for market analysis and improving trade decision-making.
By accurately identifying zones where price achieves instant balance without gaps, the indicator highlights areas likely to support strong trend continuations, exempt from common retracements.
The indicator’s use of percentage levels enables traders to pinpoint optimal entry and exit points more effectively, with levels like 50% and 75% acting as support within demand zones and resistance within supply zones. This empowers traders to ride strong trends without the worry of abrupt reversals.
Overall, the Immediate Rebalance is a reliable tool for both professional and beginner traders seeking precise methods to recognize supply and demand zones, capitalizing on consistent trends.
By choosing appropriate settings and focusing on the zones highlighted by this indicator, traders can enter trades with greater confidence and improve their risk management.
Patrick [TFO]This Patrick indicator was made for the 1 year anniversary of my Spongebob indicator, which was an experiment in using the polyline features of Pine Script to draw complex subjects. This indicator was made with the same methodology, with some helper functions to make things a bit easier on myself. It's sole purpose is to display a picture of Patrick Star on your chart, particularly the "I have $3" meme.
The initial Spongebob indicator included more than 1300 lines of code, as there were several more shapes to account for compared to Patrick, however it was done rather inefficiently. I essentially used an anchor point for each "layer" or shape (eye, nose, mouth, etc.), and drew from that point. This resulted in a ton of trial and error as I had to be very careful about the anchor points for each and every layer, and then draw around that point. In this indicator, however, I gave myself a frame to work with by specifying fixed bounds that you'll see in the code: LEFT, RIGHT, TOP, and BOTTOM.
var y_size = 4
atr = ta.atr(50)
LEFT = bar_index + 10
RIGHT = LEFT + 200
TOP = open + atr * y_size
BOTTOM = open - atr * y_size
You may notice that the top and bottom scale with the atr, or Average True Range to account for varying price fluctuations on different assets.
With these limits established, I could write some simple functions to translate my coordinates, using a range of 0-100 to describe how far the X coordinates should be from left to right, where left is 0 and right is 100; and likewise how far the Y coordinates should be from bottom to top, where bottom is 0 and top is 100.
X(float P) =>
result = LEFT + math.floor((RIGHT - LEFT)*P/100)
Y(float P) =>
result = BOTTOM + (TOP - BOTTOM)*P/100
With these functions, I could then start drawing points much simpler, with respect to the overall frame of the picture. If I wanted a point in the dead center of the frame, I would choose X(50), Y(50) for example.
At this point, the process just became tediously drawing each layer of my reference picture, including but not limited to Patrick's body, arm, mouth, eyes, eyebrows, etc. I've attached the reference picture here (left), without the text enabled.
As tedious as this was to create, it was done much more efficiently than Spongebob, and the ideas used here will make it much easier to draw more complex subjects in the future.
Multi-Timeframe RangeThe Multi-Timeframe Range Indicator is designed for traders looking to monitor key price levels across various timeframes (Daily, Weekly, Monthly, Quarterly, and Yearly) directly on their charts. This indicator draws boxes and mid-lines for each timeframe’s high, low, and midpoint, enabling users to visualize price ranges and assess potential areas of support and resistance more effectively.
Features:
Dynamic Range Boxes: Displays the high, low, and midpoint levels for each specified timeframe, with customizable colors for easy differentiation.
Visual Cues for Monday’s Levels: Highlights Monday’s high, low, and midpoint levels each week to support intraday trading setups and weekly trend analysis.
Multi-Timeframe Flexibility: Easily toggle between timeframes to view ranges from daily to yearly, making this indicator suitable for both short-term and long-term traders.
Ideal Use Cases:
Identify key support and resistance zones based on multiple timeframes.
Assess weekly and monthly trends using the Monday range levels.
Gain insights into market structure across various timeframes.

Daily ATR 2 and 10 Percent Value
This indicator shows three values: the main ATR value, a 2% value,
and a 10% Value of the Daily ATR.
After you have added the indicator to your chart, follow these steps
to be able to see the values and labels on the right.
1. Right-click on the price level bar or click the gear icon at the bottom
2. Click on LABELS
3. Select with a check mark the following two
INDICATORS AND FINANCIAL NAME LABELS
and INDICATORS AND FINANCIAL VALUE LABELS
4. Look for D-ATR % Value, click on the gear icon and verify these settings
- D-ATR Lenght = 14
- ATR Lenght = 14
- Smoothing = RMA
- Timeframe = 1 Day
5. Select Wait for timeframe closes
6. Click on Defaults, Save as default, and click ok.
You can move the indicator to the top of your chart if preferred, by clicking
on Move pane up.
Slightly modifications from other indicators.

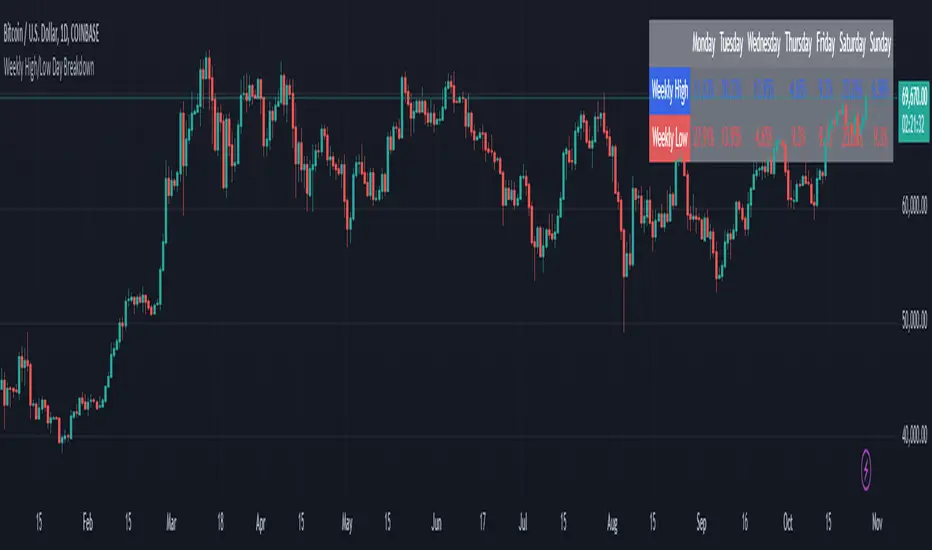
Weekly High/Low Day BreakdownThe "Weekly High/Low Day Breakdown" is a tool designed to help identify patterns in market behaviour by analysing the days of the week when weekly highs and lows occur. This indicator calculates the frequency and percentage of weekly highs and lows for each day from Monday to Sunday within the visible range of your chart.
Features:
Weekly Analysis: Calculates weekly highs and lows based on daily open high and low prices from Monday to Sunday.
Day-Specific Breakdown: Tracks which day of the week each weekly high and low occurred.
Visible Range Focus: Only considers data within the current visible range of your chart for precise analysis.
Interactive Table Display: Presents the results in an easy-to-read table directly on your chart.
How It Works:
Data Collection: Fetches daily high, low, day of the week, and time data regardless of your chart's timeframe. Uses these daily figures to determine the weekly high and low for each week.
Weekly Tracking: Monitors the day of the week when the weekly high and low prices occur. Resets tracking at the end of each week (Sunday).
Visible Range Analysis: Only includes weeks that fall entirely within the visible time range of your chart. Ensures that the analysis is relevant to the period you are focusing on.
Percentage Calculation: Counts the occurrences of weekly highs and lows for each day. Calculates the percentage based on the total number of weeks in the visible range.
Result Display: Generates a table with days of the week as columns and "Weekly High" and "Weekly Low" as rows. Displays the percentage values, indicating how often highs and lows occur on each day.
How to Use:
Add the Indicator: Apply the "Weekly High/Low Day Breakdown" indicator to your TradingView chart.
Adjust Visible Range: Zoom in or out to set the desired visible time range for your analysis.
Interpret the Table:
Columns: Represent days from Monday to Sunday.
"Weekly High" Row: Shows the percentage of times the weekly high occurred on each day. "Weekly Low" Row: Shows the percentage of times the weekly low occurred on each day.
Colors: Blue text indicates high percentages, red text indicates low percentages.
Example Interpretation:
If the table shows a 30% value under "Tuesday" for "Weekly High," it means that in 30% of the weeks within the visible range, the highest price of the week occurred on a Tuesday.
Similarly, a 40% value under "Friday" for "Weekly Low" indicates that 40% of the weekly lows happened on a Friday.
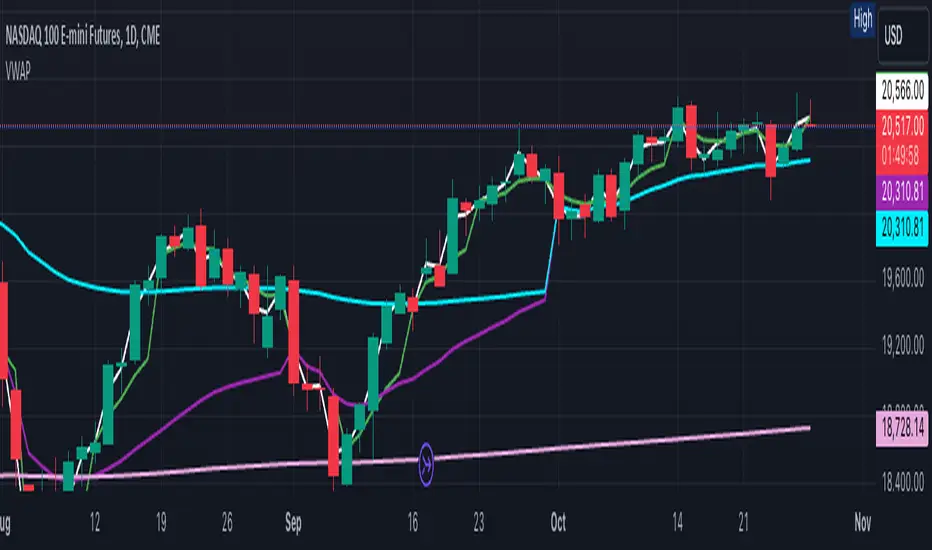
VWAP it GOODWhy: Instead of having 5 individual VWAP indicators, I found it beneficial for one view with a clean display. This VWAP indicator combines the daily, weekly, monthly, quarterly and annual into one color coded view. These colors and styles can be modified by the user.
A user can turn any timeframe off, but this is how I personally like to trade since it helps me better understand potential bounce or pullback areas.
Do your own research for what is best for you.
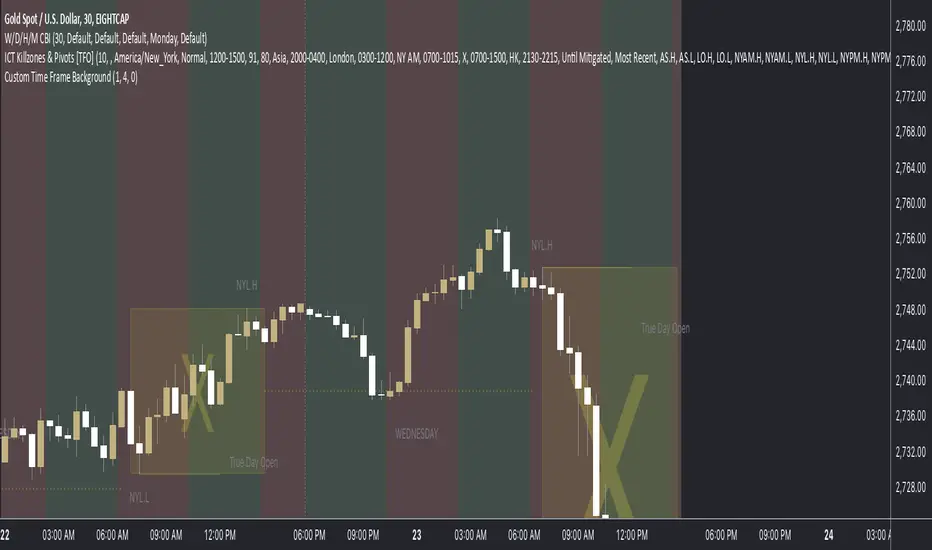
Custom Time Frame BackgroundThis indicator allows you to highlight custom time frames on your chart with alternating background colors. It's particularly useful for visualizing specific intervals that are not standard on TradingView, such as 4-hour, 6-hour, or any other custom duration you choose. Features:
Customizable time frames: Set any combination of minutes, hours, and days
Fallback to daily/weekly coloring if no custom time frame is set
User-defined colors for alternating backgrounds
How to use:
Add the indicator to your chart
In the settings, input your desired custom time frame:
Set 'Custom Minutes' for intervals less than an hour
Use 'Custom Hours' for hourly intervals
Use 'Custom Days' for daily intervals
Adjust 'Color 1' and 'Color 2' to your preferred background colors
Examples:
For a 4-hour time frame: Set Custom Hours to 4
For a 6-hour time frame: Set Custom Hours to 6
For a 2-day time frame: Set Custom Days to 2
If all inputs are set to 0, the indicator will default to daily coloring for intraday charts and weekly coloring for higher timeframes. This indicator helps traders visually segment their charts into custom intervals, making it easier to identify patterns and trends over specific time periods.
Z-Score Weighted Trend System I [InvestorUnknown]The Z-Score Weighted Trend System I is an advanced and experimental trading indicator designed to utilize a combination of slow and fast indicators for a comprehensive analysis of market trends. The system is designed to identify stable trends using slower indicators while capturing rapid market shifts through dynamically weighted fast indicators. The core of this indicator is the dynamic weighting mechanism that utilizes the Z-score of price , allowing the system to respond effectively to significant market movements.
Dynamic Z-Score-Based Weighting System
The Z-Score Weighted Trend System I utilizes the Z-score of price to assign weights dynamically to fast indicators. This mechanism is designed to capture rapid market shifts at potential turning points, providing timely entry and exit signals.
Traders can choose from two primary weighting mechanisms:
Threshold-Based Weighting: The fast indicators are given weight only when the absolute Z-score exceeds a user-defined threshold. Below this threshold, fast indicators have no impact on the final signal.
Continuous Weighting: By setting the threshold to zero, fast indicators always contribute to the final signal, regardless of Z-score levels. However, this increases the likelihood of false signals during ranging or low-volatility markets
// Calculate weight for Fast Indicators based on Z-Score (Slow Indicator weight is kept to 1 for simplicity)
f_zscore_weights(series float z, simple float weight_thre) =>
float fast_weight = na
float slow_weight = na
if weight_thre > 0
if math.abs(z) <= weight_thre
fast_weight := 0
slow_weight := 1
else
fast_weight := 0 + math.sqrt(math.abs(z))
slow_weight := 1
else
fast_weight := 0 + math.sqrt(math.abs(z))
slow_weight := 1
Choice of Z-Score Normalization
Traders have the flexibility to select different Z-score processing methods to better suit their trading preferences:
Raw Z-Score or Moving Average: Traders can opt for either the raw Z-score or a moving average of the Z-score to smooth out fluctuations.
Normalized Z-Score (ranging from -1 to 1) or Z-Score Percentile: The normalized Z-score is simply the raw Z-score divided by 3, while the Z-score percentile utilizes a normal distribution for transformation.
f_zscore_perc(series float zscore_src, simple int zscore_len, simple string zscore_a, simple string zscore_b, simple string ma_type, simple int ma_len) =>
z = (zscore_src - ta.sma(zscore_src, zscore_len)) / ta.stdev(zscore_src, zscore_len)
zscore = switch zscore_a
"Z-Score" => z
"Z-Score MA" => ma_type == "EMA" ? (ta.ema(z, ma_len)) : (ta.sma(z, ma_len))
output = switch zscore_b
"Normalized Z-Score" => (zscore / 3) > 1 ? 1 : (zscore / 3) < -1 ? -1 : (zscore / 3)
"Z-Score Percentile" => (f_percentileFromZScore(zscore) - 0.5) * 2
output
Slow and Fast Indicators
The indicator uses a combination of slow and fast indicators:
Slow Indicators (constant weight) for stable trend identification: DMI (Directional Movement Index), CCI (Commodity Channel Index), Aroon
Fast Indicators (dynamic weight) to identify rapid trend shifts: ZLEMA (Zero-Lag Exponential Moving Average), IIRF (Infinite Impulse Response Filter)
Each indicator is calculated using for-loop methods to provide a smoothed and averaged view of price data over varying lengths, ensuring stability for slow indicators and responsiveness for fast indicators.
Signal Calculation
The final trading signal is determined by a weighted combination of both slow and fast indicators. The slow indicators provide a stable view of the trend, while the fast indicators offer agile responses to rapid market movements. The signal calculation takes into account the dynamic weighting of fast indicators based on the Z-score:
// Calculate Signal (as weighted average)
float sig = math.round(((DMI*slow_w) + (CCI*slow_w) + (Aroon*slow_w) + (ZLEMA*fast_w) + (IIRF*fast_w)) / (3*slow_w + 2*fast_w), 2)
Backtest Mode and Performance Metrics
The indicator features a detailed backtesting mode, allowing traders to compare the effectiveness of their selected settings against a traditional Buy & Hold strategy. The backtesting provides:
Equity calculation based on signals generated by the indicator.
Performance metrics comparing Buy & Hold metrics with the system’s signals, including: Mean, positive, and negative return percentages, Standard deviations, Sharpe, Sortino, and Omega Ratios
// Calculate Performance Metrics
f_PerformanceMetrics(series float base, int Lookback, simple float startDate, bool Annualize = true) =>
// Initialize variables for positive and negative returns
pos_sum = 0.0
neg_sum = 0.0
pos_count = 0
neg_count = 0
returns_sum = 0.0
returns_squared_sum = 0.0
pos_returns_squared_sum = 0.0
neg_returns_squared_sum = 0.0
// Loop through the past 'Lookback' bars to calculate sums and counts
if (time >= startDate)
for i = 0 to Lookback - 1
r = (base - base ) / base
returns_sum += r
returns_squared_sum += r * r
if r > 0
pos_sum += r
pos_count += 1
pos_returns_squared_sum += r * r
if r < 0
neg_sum += r
neg_count += 1
neg_returns_squared_sum += r * r
float export_array = array.new_float(12)
// Calculate means
mean_all = math.round((returns_sum / Lookback), 4)
mean_pos = math.round((pos_count != 0 ? pos_sum / pos_count : na), 4)
mean_neg = math.round((neg_count != 0 ? neg_sum / neg_count : na), 4)
// Calculate standard deviations
stddev_all = math.round((math.sqrt((returns_squared_sum - (returns_sum * returns_sum) / Lookback) / Lookback)) * 100, 2)
stddev_pos = math.round((pos_count != 0 ? math.sqrt((pos_returns_squared_sum - (pos_sum * pos_sum) / pos_count) / pos_count) : na) * 100, 2)
stddev_neg = math.round((neg_count != 0 ? math.sqrt((neg_returns_squared_sum - (neg_sum * neg_sum) / neg_count) / neg_count) : na) * 100, 2)
// Calculate probabilities
prob_pos = math.round((pos_count / Lookback) * 100, 2)
prob_neg = math.round((neg_count / Lookback) * 100, 2)
prob_neu = math.round(((Lookback - pos_count - neg_count) / Lookback) * 100, 2)
// Calculate ratios
sharpe_ratio = math.round((mean_all / stddev_all * (Annualize ? math.sqrt(Lookback) : 1))* 100, 2)
sortino_ratio = math.round((mean_all / stddev_neg * (Annualize ? math.sqrt(Lookback) : 1))* 100, 2)
omega_ratio = math.round(pos_sum / math.abs(neg_sum), 2)
// Set values in the array
array.set(export_array, 0, mean_all), array.set(export_array, 1, mean_pos), array.set(export_array, 2, mean_neg),
array.set(export_array, 3, stddev_all), array.set(export_array, 4, stddev_pos), array.set(export_array, 5, stddev_neg),
array.set(export_array, 6, prob_pos), array.set(export_array, 7, prob_neu), array.set(export_array, 8, prob_neg),
array.set(export_array, 9, sharpe_ratio), array.set(export_array, 10, sortino_ratio), array.set(export_array, 11, omega_ratio)
// Export the array
export_array
//}
Calibration Mode
A Calibration Mode is included for traders to focus on individual indicators, helping them fine-tune their settings without the influence of other components. In Calibration Mode, the user can visualize each indicator separately, making it easier to adjust parameters.
Alerts
The indicator includes alerts for long and short signals when the indicator changes direction, allowing traders to set automated notifications for key market events.
// Alert Conditions
alertcondition(long_alert, "LONG (Z-Score Weighted Trend System)", "Z-Score Weighted Trend System flipped ⬆LONG⬆")
alertcondition(short_alert, "SHORT (Z-Score Weighted Trend System)", "Z-Score Weighted Trend System flipped ⬇Short⬇")
Important Note:
The default settings of this indicator are not optimized for any particular market condition. They are generic starting points for experimentation. Traders are encouraged to use the calibration tools and backtesting features to adjust the system to their specific trading needs.
The results generated from the backtest are purely historical and are not indicative of future results. Market conditions can change, and the performance of this system may differ under different circumstances. Traders and investors should exercise caution and conduct their own research before using this indicator for any trading decisions.

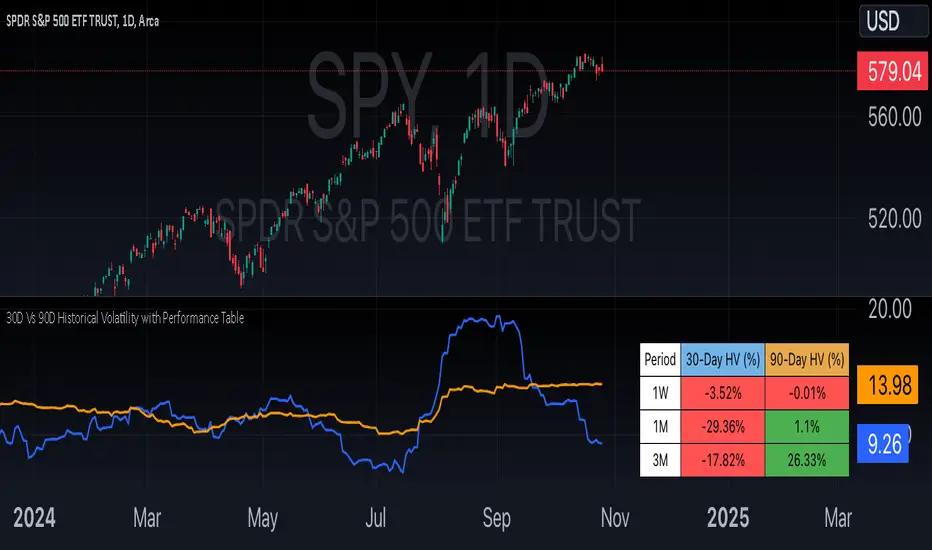
30D Vs 90D Historical VolatilityVolatility equals risk for an underlying asset's price meaning bullish volatility is bearish for prices while bearish volatility is bullish. This compares 30-Day Historical Volatility to 90-Day Historical Volatility.
When the 30-Day crosses under the 90-day, this is typically when asset prices enter a bullish trend.
Conversely, When the 30-Day crosses above the 90-Day, this is when asset prices enter a bearish trend.
Peaks in volatility are bullish divergences while troughs are bearish divergences.
4AM-5AM BRT HighlighterThe 4AM-5AM BRT Highlighter is a simple yet effective tool designed to visually mark your preferred trading time on the chart. It highlights the period between 4:00 AM and 5:00 AM Brazilian Time (BRT/UTC-3) by default, helping you stay focused and aware of your prime trading window.
Key Features:
Clear Visual Highlight: Colors the background of your chart during the chosen timeframe, making it easy to see when your trading session starts and ends.
Customizable Colors: Easily adjust the highlight color and transparency to suit your visual preferences.
Accurate Time Conversion: Automatically accounts for Brazilian Time (BRT), ensuring the highlight appears correctly no matter your chart’s default timezone.
Whether you're trading currencies, metals, indexes, or cryptocurrencies, this indicator helps you maintain focus during your dedicated trading hour by clearly marking your active period on the chart.
Buy and Sell Signals Based on SMI {K28}Buy/Sell Signals Based on SMI
This indicator provides buy and sell signals based on the Stochastic Momentum Index (SMI) to assist traders in identifying potential entry and exit points in the market. Here’s how to effectively use this indicator:
Usage Instructions:
Signal Interpretation:
No signal is 100% guaranteed
Green Labels: Indicate strong buy signals when the SMI crosses above its EMA, especially if the candle is green (closing price higher than opening price).
Red Labels: Indicate strong sell signals when the SMI crosses below its EMA.
Cautious Signals:
Blue Buy Labels: These buy signals appear when the SMI is in a cautious zone (between -20 and 20). They may not be as reliable, so confirm these signals with other indicators before acting.
Yellow Sell Labels: These buy signals appear when the SMI is in a cautious zone (between -20 and 20). They may not be as reliable, so confirm these signals with other indicators before acting.
Gray Buy and Sell Labels: Indicate potential false signals (when the SMI is overbought or oversold). Use other confirmation indicators to verify these signals.
Trade Strategy:
This indicator is designed for traders looking to make small, consistent profits. Focus on executing more trades rather than waiting for larger price movements.
Be mindful that the indicator may yield frequent signals, so it's essential to maintain discipline and only take trades that meet your criteria for confirmation.
Important Notes:
Caution with Signals: Always exercise caution when acting on blue or gray labels. These may indicate less reliable signals, so it's crucial to confirm with additional indicators.
No Perfect Indicator: Please remember that no trading indicator is perfect. Use this indicator at your own risk, and consider incorporating risk management strategies into your trading plan.
Conclusion:
By employing this SMI indicator, you can enhance your trading strategy focused on generating small, consistent profits through frequent trades. However, always verify signals and stay aware of market conditions to optimize your trading performance.
