OPEN-SOURCE SCRIPT
تم تحديثه Time Segmented Volume, TSV Cipher + TSI
THE IDEA:
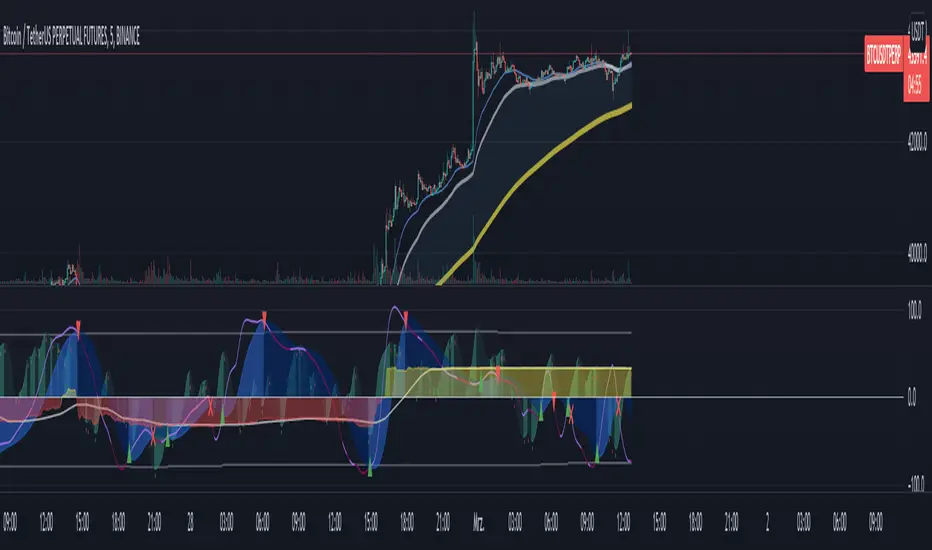
TSV is a leading indicator based on the Volume, so it can be used to dectect price movements even before other indicators.
You can read about the Time Segmented Volume and the concept how to use it here:

From my observations, it seems like you can use this indicator in the similar way to "oscilators" as well.
So the idea is to use the signal and run in trough:
1) WaveTrend - to produce "green" and "red" dots.
2) TSI
Both oscillators produce two signals that when crossed might be a buy/sell signal.
Hope you like the idea.
WARNING: Use the indicator for your own risk, it was released for educational purposes.
TSV is a leading indicator based on the Volume, so it can be used to dectect price movements even before other indicators.
You can read about the Time Segmented Volume and the concept how to use it here:
From my observations, it seems like you can use this indicator in the similar way to "oscilators" as well.
So the idea is to use the signal and run in trough:
1) WaveTrend - to produce "green" and "red" dots.
2) TSI
Both oscillators produce two signals that when crossed might be a buy/sell signal.
Hope you like the idea.
WARNING: Use the indicator for your own risk, it was released for educational purposes.
ملاحظات الأخبار
* Simplified the charts* Changed TSV normalize method
* Added description
ملاحظات الأخبار
* Improved default settings* More settings: including separated long and fast settings - feel free to adjust it to the timeframe you are using
* More settings: color customization
نص برمجي مفتوح المصدر
بروح TradingView الحقيقية، قام مبتكر هذا النص البرمجي بجعله مفتوح المصدر، بحيث يمكن للمتداولين مراجعة وظائفه والتحقق منها. شكرا للمؤلف! بينما يمكنك استخدامه مجانًا، تذكر أن إعادة نشر الكود يخضع لقواعد الموقع الخاصة بنا.
إخلاء المسؤولية
لا يُقصد بالمعلومات والمنشورات أن تكون، أو تشكل، أي نصيحة مالية أو استثمارية أو تجارية أو أنواع أخرى من النصائح أو التوصيات المقدمة أو المعتمدة من TradingView. اقرأ المزيد في شروط الاستخدام.