OPEN-SOURCE SCRIPT
تم تحديثه Candle Information Panel
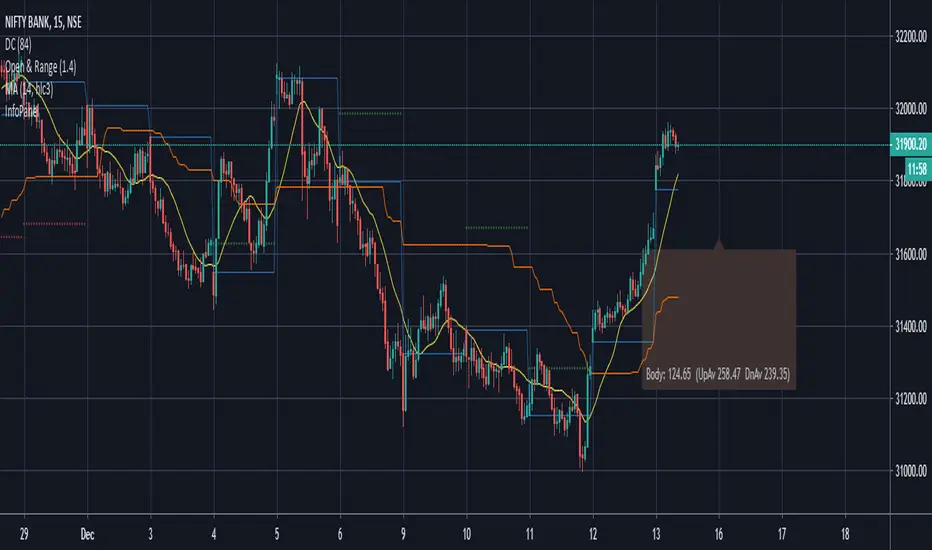
//This indicator shows Day's candle measurements with past averages. First column shows the candle details for the present day.
//"Open - Low", "High - Open", "Range(=High-low)", "Body(open-close)"
//Averages are calculated for occurences of Green and Red days. Up Averages are for Green days and Down Averages are for Red days.
//Average are not perfect calculations since occurences(of Red or Green) will vary within the timespan used for averages.
//This can used to guage general sense of probability of the price movement.
//e.g. if the Open to Low for a day exceeds UpAv value, then there is higher likelihood of day being Red.
//similarly, trade can be held in expectation of price reaching the DnAv and stop loss can be trailed accordingly.
//Not a perfect system. But something to work on further to increase price action understanding.
//Be careful on days where consecutive 3rd Highest High or Lowest Low day is made and also on the next day after such day. Prices may turn direction at least for a short while.
Complete Credit goes to PineCoders who gave me the main script on tradingview chat room.
ملاحظات الأخبار
Revision 1 - Corrected formula for body calculation.نص برمجي مفتوح المصدر
بروح TradingView الحقيقية، قام مبتكر هذا النص البرمجي بجعله مفتوح المصدر، بحيث يمكن للمتداولين مراجعة وظائفه والتحقق منها. شكرا للمؤلف! بينما يمكنك استخدامه مجانًا، تذكر أن إعادة نشر الكود يخضع لقواعد الموقع الخاصة بنا.
إخلاء المسؤولية
لا يُقصد بالمعلومات والمنشورات أن تكون، أو تشكل، أي نصيحة مالية أو استثمارية أو تجارية أو أنواع أخرى من النصائح أو التوصيات المقدمة أو المعتمدة من TradingView. اقرأ المزيد في شروط الاستخدام.
نص برمجي مفتوح المصدر
بروح TradingView الحقيقية، قام مبتكر هذا النص البرمجي بجعله مفتوح المصدر، بحيث يمكن للمتداولين مراجعة وظائفه والتحقق منها. شكرا للمؤلف! بينما يمكنك استخدامه مجانًا، تذكر أن إعادة نشر الكود يخضع لقواعد الموقع الخاصة بنا.
إخلاء المسؤولية
لا يُقصد بالمعلومات والمنشورات أن تكون، أو تشكل، أي نصيحة مالية أو استثمارية أو تجارية أو أنواع أخرى من النصائح أو التوصيات المقدمة أو المعتمدة من TradingView. اقرأ المزيد في شروط الاستخدام.