OPEN-SOURCE SCRIPT
REVE

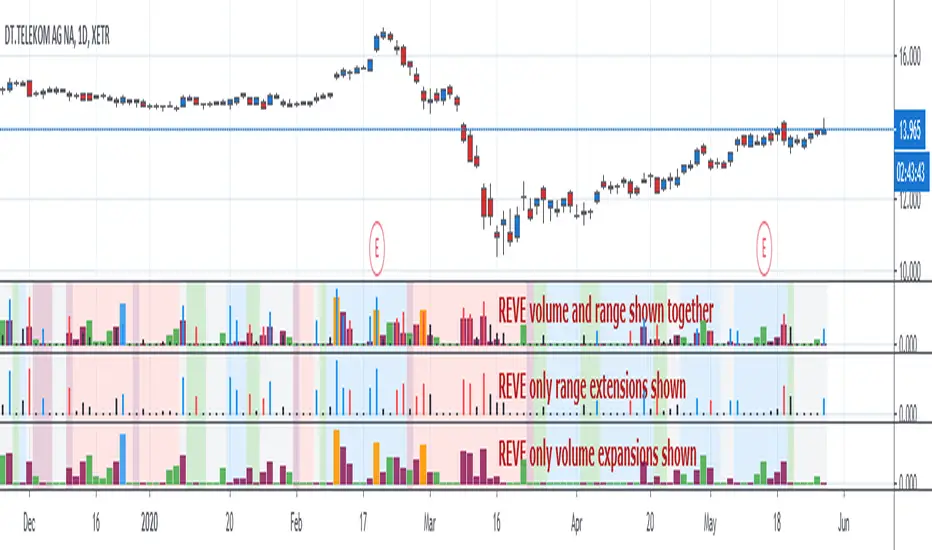
REVE is abbreviation from Range Extension Volume Expansion. This indicator shows these against a background of momentum. The histogram and columns for the range and volume rises ara calculated with the same algorithm as I use in the Volume Range Events indicator, which I published before. Because this algorithm uses the same special function to assess 'normal' levels for volume and range and uses the same calculation for depicting the rises on a scale of zero through 100, it becomes possible to compare volume and range rises in the same chart panel and come to meaningful conclusions. Different from VolumeRangeEvents is that I don't attempt to show direction of the bars and columns by actually pointing up or down. However I did color the bars for range events according to direction if Close jumps more than 20 percent of ATR up or down either blue or red. If the wider range leads to nothing, i.e. a smaller jump than 20 percent, the color is black. You can teak this in the inputs. The volume colums ar colored according to two criteria, resulting in four colors (orange, blue, maroon, green). The first criterium is whether the expansion is climactic (orange, blue) or moderate (maroon, green). I assume that climactic (i.e. more than twice as much) volume marks the beginning or end of a trend. The second criterium looks at the range event that goes together with the volume event. If lots of volume lead to little change in range (blue, green), I assume that this volume originates from institutional traders who are accumulating or distributing. If wild price jumps occur with comparatively little volume (orange, maroon, or even no volume event) I assume that opportunistic are active, some times attributing to more volume.
For the background I use the same colors calculated with the same algorithm as in the Hull Agreement Indicator, which I published before. This way I try to predict trend changes by observation of REVE.
For the background I use the same colors calculated with the same algorithm as in the Hull Agreement Indicator, which I published before. This way I try to predict trend changes by observation of REVE.
نص برمجي مفتوح المصدر
بروح TradingView الحقيقية، قام مبتكر هذا النص البرمجي بجعله مفتوح المصدر، بحيث يمكن للمتداولين مراجعة وظائفه والتحقق منها. شكرا للمؤلف! بينما يمكنك استخدامه مجانًا، تذكر أن إعادة نشر الكود يخضع لقواعد الموقع الخاصة بنا.
إخلاء المسؤولية
لا يُقصد بالمعلومات والمنشورات أن تكون، أو تشكل، أي نصيحة مالية أو استثمارية أو تجارية أو أنواع أخرى من النصائح أو التوصيات المقدمة أو المعتمدة من TradingView. اقرأ المزيد في شروط الاستخدام.