OPEN-SOURCE SCRIPT
ETN - Volume Candle
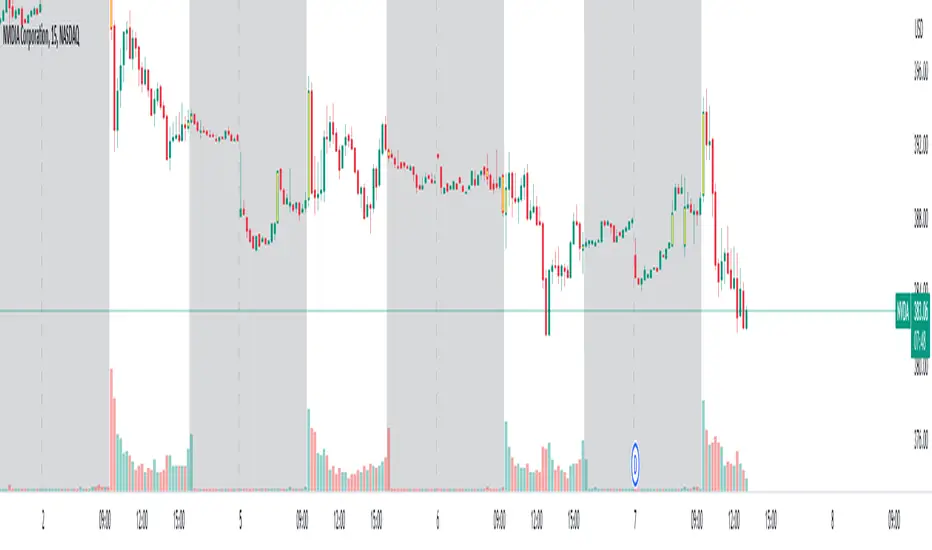
Highlights candlestick based on volume data.
Indicator looks back and analyzing volume to find the volume bar with the largest numerical value
Indicator highlights the corresponding candlestick.
Indicator marks the high and low of that candlestick.
Users can adjust lookback period. Default is set to 50.
Users can adjust how the indicator plots the high and low.
I currently have the high and low not being displayed on the charts until I come up with a better version.
On my chart, indicator colored the candlesticks YELLOW.
نص برمجي مفتوح المصدر
بروح TradingView الحقيقية، قام مبتكر هذا النص البرمجي بجعله مفتوح المصدر، بحيث يمكن للمتداولين مراجعة وظائفه والتحقق منها. شكرا للمؤلف! بينما يمكنك استخدامه مجانًا، تذكر أن إعادة نشر الكود يخضع لقواعد الموقع الخاصة بنا.
إخلاء المسؤولية
لا يُقصد بالمعلومات والمنشورات أن تكون، أو تشكل، أي نصيحة مالية أو استثمارية أو تجارية أو أنواع أخرى من النصائح أو التوصيات المقدمة أو المعتمدة من TradingView. اقرأ المزيد في شروط الاستخدام.