OPEN-SOURCE SCRIPT
Swing S/R Bounce Screener
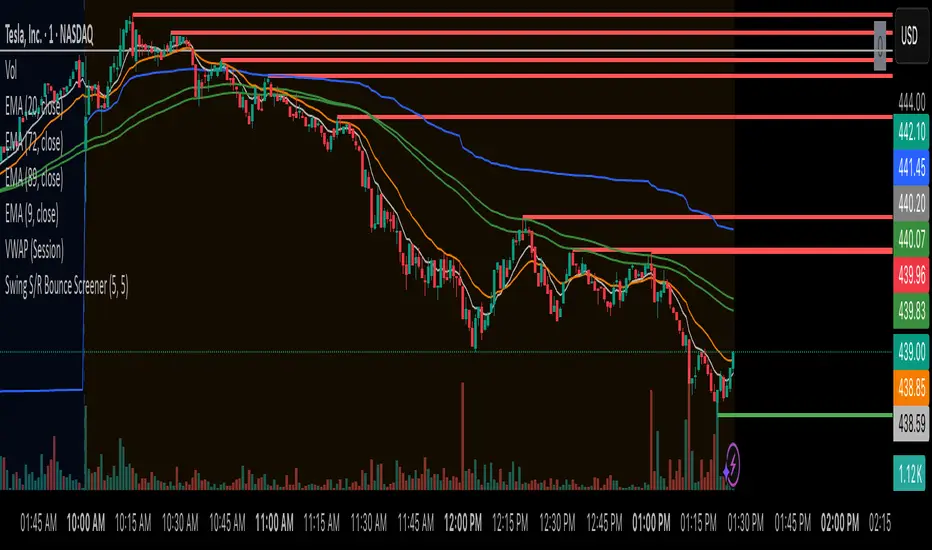
Step 1: Identify Swing Highs & Lows on 1 minute timeframe
- price bars that stand out from the 5 bars on each side (left and right). A swing high is a bar whose high is higher than the 5 bars before and after it. A swing low is a bar whose low is lower than the 5 bars before and after it.
Step 2: Draw Horizontal Lines
When a swing high/low is identified, the scanner draws a horizontal line from that point extending to the right of the chart.
Step 3: Monitor Price Returns
The scanner continuously watches for price to return to these horizontal lines. When price approaches and touches the line:
* Resistance: Price touches from below and closes below the line
* Support: Price touches from above and closes above the line
نص برمجي مفتوح المصدر
بروح TradingView الحقيقية، قام مبتكر هذا النص البرمجي بجعله مفتوح المصدر، بحيث يمكن للمتداولين مراجعة وظائفه والتحقق منها. شكرا للمؤلف! بينما يمكنك استخدامه مجانًا، تذكر أن إعادة نشر الكود يخضع لقواعد الموقع الخاصة بنا.
إخلاء المسؤولية
لا يُقصد بالمعلومات والمنشورات أن تكون، أو تشكل، أي نصيحة مالية أو استثمارية أو تجارية أو أنواع أخرى من النصائح أو التوصيات المقدمة أو المعتمدة من TradingView. اقرأ المزيد في شروط الاستخدام.