OPEN-SOURCE SCRIPT
تم تحديثه trend judgment & multi ma
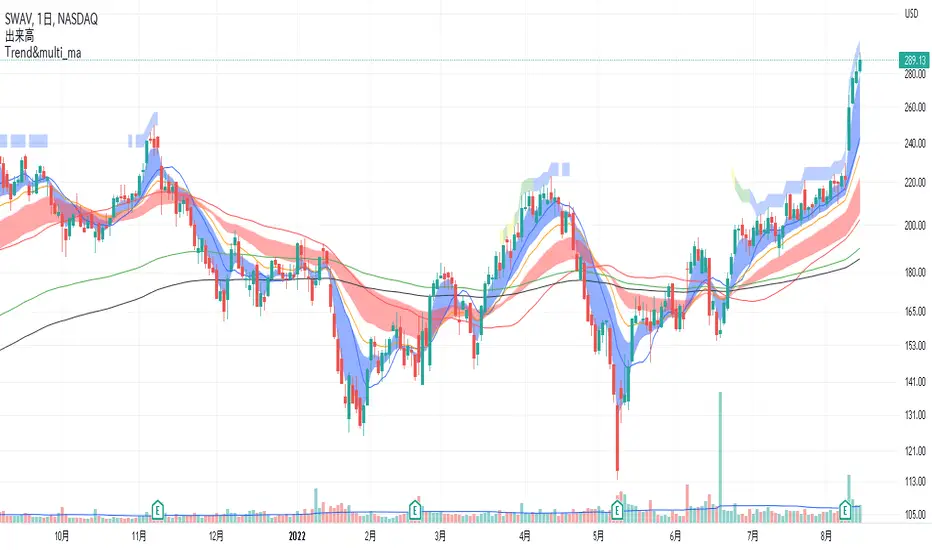
1 The background is filled with the number of matches to the trend template.
For the following conditions, 7 matches are yellow, 8 matches are green, and 9 matches are blue.
1. the stock price is above the 150-day MA and 200-day MA
2. the 50-day MA is above the 200-day MA
3. 200-day MA is in an uptrend for at least one month
4. 50-day MA is above 150-day MA and 200-day MA
5. stock price is 25% or more above 52-week low
6. stock price is 0 - 25% below 52-week high
7. IBD RS is above 70, preferably in the 90s → I don't know the exact formula, so I'm approximating with a formula that gives similar values.
8. when the stock is breaking above the base, the stock price is above the 50MA → It is difficult to judge the base itself, so it is not included in the conditions.
9. volume is high during an upward and low during a downward → volume during an upward > volume during a downward in the past 20 periods.
ex1. the 5-day MA is above the 20-day MA.
2 multi moving averages are shown.
ملاحظات الأخبار
1 The background is filled with the number of matches to the trend template.For the following conditions, 7 matches are yellow, 8 matches are green, and 9 matches are blue.
1. the stock price is above the 150-day MA and 200-day MA
2. the 150-day MA is above the 200-day MA
3. 200-day MA is in an uptrend for at least one month
4. 50-day MA is above 150-day MA and 200-day MA
5. stock price is 25% or more above 52-week low
6. stock price is 0 - 25% below 52-week high
7. IBD RS is above 70, preferably in the 90s → I don't know the exact formula, so I'm approximating with a formula that gives similar values.
8. when the stock is breaking above the base, the stock price is above the 50MA → It is difficult to judge the base itself, so it is not included in the conditions.
9. volume is high during an upward and low during a downward → volume during an upward > volume during a downward in the past 20 periods.
ex1 . the 5-day MA is above the 20-day MA.
2 multi moving averages are shown.
نص برمجي مفتوح المصدر
بروح TradingView الحقيقية، قام مبتكر هذا النص البرمجي بجعله مفتوح المصدر، بحيث يمكن للمتداولين مراجعة وظائفه والتحقق منها. شكرا للمؤلف! بينما يمكنك استخدامه مجانًا، تذكر أن إعادة نشر الكود يخضع لقواعد الموقع الخاصة بنا.
إخلاء المسؤولية
لا يُقصد بالمعلومات والمنشورات أن تكون، أو تشكل، أي نصيحة مالية أو استثمارية أو تجارية أو أنواع أخرى من النصائح أو التوصيات المقدمة أو المعتمدة من TradingView. اقرأ المزيد في شروط الاستخدام.