PROTECTED SOURCE SCRIPT
Correlation Tracker - Joe v1
Correlation Tracker – Joe v1
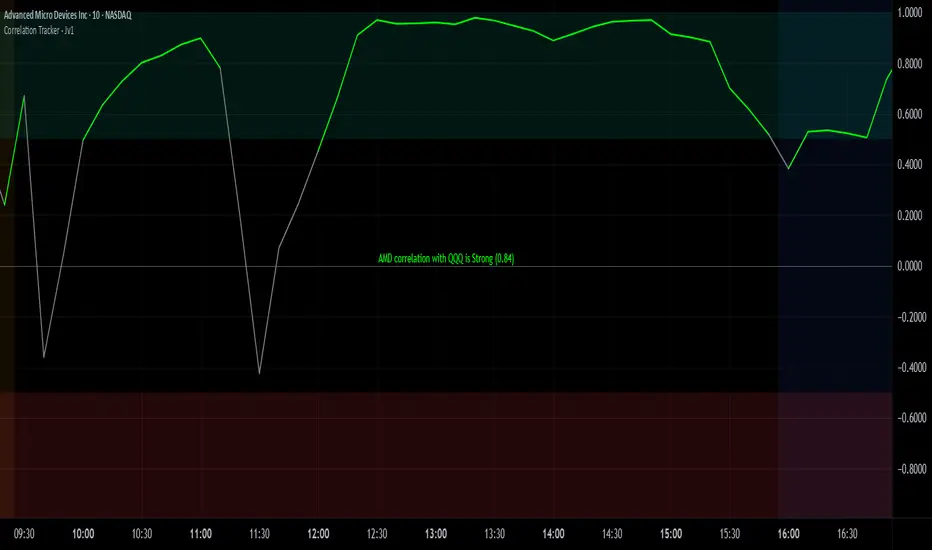
This indicator calculates the correlation between a selected ticker and an index over a user-defined period. It visualizes correlation with color-coded lines, thresholds, and a descriptive rating, helping traders quickly gauge the strength and direction of correlation.
________________________________________
Options and What They Do
General Settings
• Symbol: Select the ticker you want to analyze.
• Use Chart Symbol: If enabled, the script will use the symbol of the current chart instead of a manually selected symbol.
• Index: Choose the reference index or asset to compare the correlation against. Default is NASDAQ:QQQ.
• Length: Sets the number of periods used to calculate correlation via a moving average. Shorter lengths respond faster; longer lengths smooth correlation.
Correlation Rating Settings
• Show Correlation Rating: Display a textual description of correlation strength (e.g., Ultra Strong, Moderate, Weak).
• Position: Choose where the correlation rating table will appear on the chart (Top/Bottom, Left/Center/Right).
Correlation Line Settings
• Positive Color: Line color when correlation is above the positive threshold. Default: green.
• Negative Color: Line color when correlation is below the negative threshold. Default: red.
• Neutral Color: Line color when correlation is between thresholds. Default: gray.
Correlation Thresholds
• Positive – From: Minimum correlation value considered positive. Default: 0.5 (range 0–0.9).
• Positive Color BG: Background color fill for positive correlation range.
• Negative – From: Maximum correlation value considered negative. Default: -0.5 (range -0.9–0).
• Negative Color BG: Background color fill for negative correlation range.
________________________________________
How It Works
1. Calculates correlation between the selected ticker and the index using logarithmic returns.
2. Plots the correlation line with colors based on thresholds: positive (green), negative (red), neutral (gray).
3. Displays a correlation rating table showing strength (Ultra Weak → Ultra Strong) and absolute correlation on a 0–1 scale.
4. Allows customization of visual appearance, thresholds, and position of rating for clarity on any chart.
نص برمجي محمي
تم نشر هذا النص البرمجي كمصدر مغلق. ومع ذلك، يمكنك استخدامه بحرية ودون أي قيود - تعرف على المزيد هنا.
إخلاء المسؤولية
لا يُقصد بالمعلومات والمنشورات أن تكون، أو تشكل، أي نصيحة مالية أو استثمارية أو تجارية أو أنواع أخرى من النصائح أو التوصيات المقدمة أو المعتمدة من TradingView. اقرأ المزيد في شروط الاستخدام.