VIV 1.0 // AN IDEA BY Sunil Sethi
Key Features (Expanded Concepts)
01. Trend-Based Analysis with Stages and Background Colors
VIV breaks down the market into three color-coded stages based on trend confirmation:
Stage 3: Uptrend (Short-Term Trend Confirmation)
- Marks early accumulation or consolidation.
- Shows possible reversal zones.
- Short-term traders use this to spot opportunities before a breakout.
Stage 2: Uptrend (Medium-Term Trend Confirmation)
- Highlights the start of a strong directional move.
- Confidence zone for position building and breakout-following strategies.
Stage 1: Uptrend (Long-Term Trend Confirmation)
- Indicates long term strength.
These trend stages reflect the emotional phases of market participants and the shifting balance of power between buyers and sellers. You can toggle trend backgrounds for intraday, daily, weekly, and monthly trends and change their background colors.
Note : If the % difference in Stage 3 exceeds 10%, the stock is considered extended. Such setups should be evaluated with caution before making any trade decisions.
02. . Volume Footprints (➕ Signs)
VIV intelligently identifies past candles with high-volume activity (accumulation/distribution).
- These are not typical breakout volumes, but subtle footprints of smart money.
- Help spot reversal points, liquidity zones, and retest levels.
- Valuable for both breakout and reversal traders to confirm zone strength.
- You can enable or disable these lines, adjust color, style, and width via VIV Line Settings.
03. VIV || H, VIV || L and VIV || C Zones
Automatically plots horizontal levels from high-volume, high-activity candles—revealing the footprints of smart money.
- VIV || H (High) = Top of important bar.
- VIV || L (Low) = Bottom of important bar.
- VIV || C (Close) = Close price of important bar.
- Key levels used by traders for:
- Entries
- Stop-loss placement
- Targets
These zones show where price historically reacted due to strong institutional presence. They come with customizable label colors and backgrounds.
04. Price Tightness Detection
Detects when two or more candles compress within the range of a larger parent candle.
Represents indecision, contraction, or coiling behavior before major price moves.
Ideal for both:
- Breakout traders looking for base formations.
- Reversal traders watching for exhaustion.
Color-coded markers indicate such tight price zones — disabled by default but can be enabled.
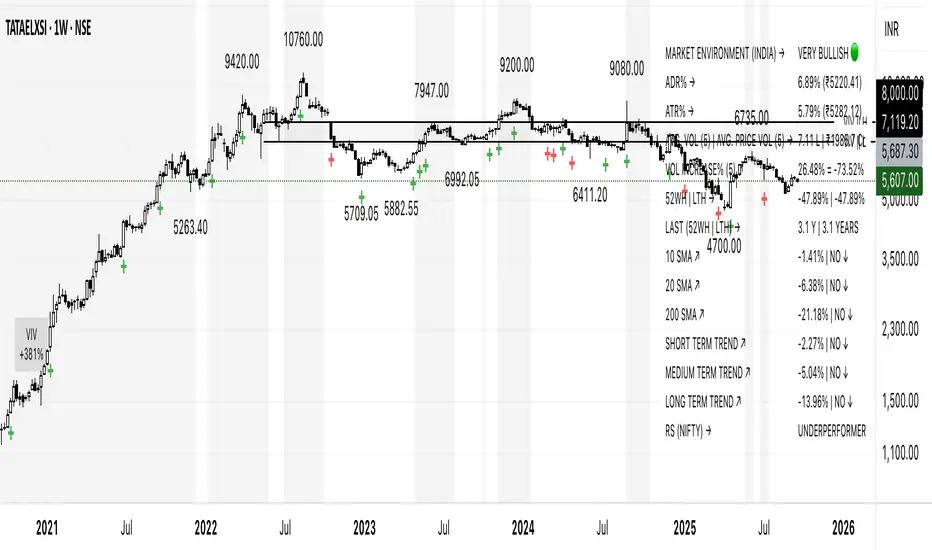
05. Technical Stats Panel (Important Data Table)
An insightful dashboard providing:
- ADR% – Volatility-based movement expectations (change period via input).
- ATR – Real volatility indicator.
- Average Volume / Price Volume – Customizable average period and currency unit (INR/USD).
Trend Data:
- 10/20/200 SMAs
- 10-week & 20-week trend stages (custom SMA period/timeframe supported)
Relative Strength vs Benchmark
- RS grade: GREAT, GOOD, FAIR, UNCERTAIN, UNDER PERFORMER, LAGGARD, POOR
- When RS is comparing: BOTH STRONG, BOTH WEEK
- You can also display the benchmark symbol name and change the symbol for relative strength comparison.
06. Relative Strength Grade Change Alerts
VIV tracks relative strength changes against a chosen benchmark (e.g., Nifty MidSmallCap).
The above tells us that if the stock is stronger or weaker than the benchmark.
Detects when relative strength shifts from:
- Strong → Weak (e.g., EXCELLENT → GOOD → FAIR)
- Weak → Strong (e.g., LAGGARD → POOR → FAIR → GOOD)
- Sudden transitions (e.g., WORST → FAIR, BOTH WEAK → GOOD, BOTH GOOD → POOR)
- BOTH WEAK → GOOD or BOTH GOOD → POOR means stock's strength is better/poor than the benchmark
- and more.
These alerts can help in:
- Early trend following
- Exiting when RS degrades
- Adding positions when RS improves
07. Smart Alerts (Built-in Conditions)
You can set alerts for (any timeframe)
- Positive Trend
- Negative Trend
- Rise in Volume
- Relative Strength Changed
Set your preferred interval and trigger type in TradingView to stay updated without chart-watching.
08. Pivot Points
VIV allows visualizing pivot highs and lows using a dynamic window (left/right lookback).
- Customizable label text and background color.
- Helpful in identifying support or resistance zones and breakout points.
09. Customization Options
Toggle modules like trend background, labels, stats, and volume zones.
Customize colors for:
- Labels
- Zones
- Trend backgrounds
- Table text, borders, and alignment
- Adjust visibility per timeframe (inputs tab)
How to Use VIV Effectively
- Use trend background colors to identify phase (base, uptrend, top).
- Look for stage 1, stage 2 and stage 3 for short, medium and long term trend.
- Watch for old high-volume candles (➕ marks) to plan entries/exits.
- Trade around ➕ marks, VIV || H and VIV || L levels.
- Use tight price zones to anticipate explosive moves.
- Monitor table for ATR/ADR, RS grade, and moving averages.
- Use alerts to automate monitoring of trend, volume, or RS shifts.
Best Suited For:
- Reversal traders (demand/supply based)
- Breakout traders using base-building logic
- Systematic or discretionary traders
- Anyone who values price-volume behavior over lagging indicators
STAGE 3 → SHORT TERM TREND
STAGE 2 → MEDIUM TERM TREND
STAGE 3 → LONG TERM TREND
2. NOW AVG. VOL WILL ALSO SHOW LIKE CR/L/K (CRORES/LAKH/THOUSAND) IF AVG. PRICE VOLUME IS INR. EARLIER IT WAS SHOWING IN M/K (MILLION/THOUSAND) ONLY
We’ve made some key improvements to make your trading experience even smoother:
What’s New in V1.1?
Stage names are now clearer and renamed as “Trend Base” to avoid confusion:
Stage 3 → Short-Term Trend
Stage 2 → Medium-Term Trend
Stage 1 → Long-Term Trend
Improved Volume Display:
If your price/volume is in INR, average volume will now display as CR / L / K (Crore / Lakh / Thousand) instead of just M / K (Million / Thousand).
Makes it easier to read at a glance!
Table Positioning – The important values table can now be placed at "Middle Left" or "Middle Right" for better visibility.
Volume Increase% Display – Enhanced volume metric:
- Earlier: 125% or 75%
- Now: 125% (+25%) or 75% (−25%)
This makes it instantly clear whether volume is above or below the average and by how much.
2. UPDATES
Now table will show the selected number of days for Avg. Volume and Volume increase%
i.e. AVG. VOL (5) and VOLUME INCREASE% (5)
1. Bug Fix – Corrected Long-Term Trend display (YES/NO) in the table.
2. Price Tightness Enhancements
- Added toggle to show/hide price tightness.
- Option to display or hide horizontal lines on the high and low of the parent candle.
- Customizable line colors for better chart visibility.
🔧 FIX: Price Tightness Lines Color
Previously, the option to change the color of Price Tightness lines was available but not functioning correctly. Now, the color customization works as intended.
🔥 New Feature: Market Environment
Added Market Environment Analysis.
Market Environment categories:
🟢 Very Bullish
🟢 Bullish
🔵 Be Careful
🟠 Uncertain
🔴 Bearish
🌍 Global Index Support
Added Country Selector dropdown in settings.
Automatically maps major country → benchmark index:
🇮🇳 India → Nifty 50
🇺🇸 America → S&P 500
🇩🇪 Germany → DAX
🇬🇧 United Kingdom → FTSE 100 (UKX)
🇭🇰 Hong Kong → HSI
🇧🇷 Brazil → IBOV
🇷🇺 Russia → IMOEX
🇰🇷 Korea → KOSPI
🇨🇳 China → Shanghai Composite
🇫🇷 France → CAC 40
🇨🇦 Canada → TSX
🎨 UI Enhancements
Market Environment shown on chart table as a clean label.
Round colored icons for conditions (🟢🟢🔵🟠🔴)
Option in settings to Show / Hide Market Environment.
e.g. MARKET ENVIRONMENT (INDIA) → Very Bullish 🟢
Now market environment is available for world's top 10 economies including USA, China, Germany, Japan, India, UK, France, Italy, Canada and Brazil + Russia (Bonus)
This update brings ADR% & ATR% improvements:
Adjusted Price Levels → Alongside ADR% & ATR%, VIV now shows the price after applying the % range.
Example: ADR% = 0.5 and Price = 100 → ADR% = 0.5% (99.5)
Practical Stop Usage → These adjusted levels can now be used as dynamic stop-loss references, helping you place stops based on real volatility instead of guesswork.
Makes risk & range more actionable, visible, and trader-friendly.
🚀 Another step in making VIV not just an indicator, but a decision-making toolkit.
End of V1.7 update
نص برمجي للمستخدمين المدعوين فقط
Only users approved by the author can access this script. You'll need to request and get permission to use it. This is typically granted after payment. For more details, follow the author's instructions below or contact lifensunil directly.
TradingView does NOT recommend paying for or using a script unless you fully trust its author and understand how it works. You may also find free, open-source alternatives in our community scripts.
تعليمات المؤلف
إخلاء المسؤولية
نص برمجي للمستخدمين المدعوين فقط
Only users approved by the author can access this script. You'll need to request and get permission to use it. This is typically granted after payment. For more details, follow the author's instructions below or contact lifensunil directly.
TradingView does NOT recommend paying for or using a script unless you fully trust its author and understand how it works. You may also find free, open-source alternatives in our community scripts.