PROTECTED SOURCE SCRIPT
VWAP Cloud
VWAP Cloud
– Dynamic Fair Value Zones with Standard Deviation Envelopes
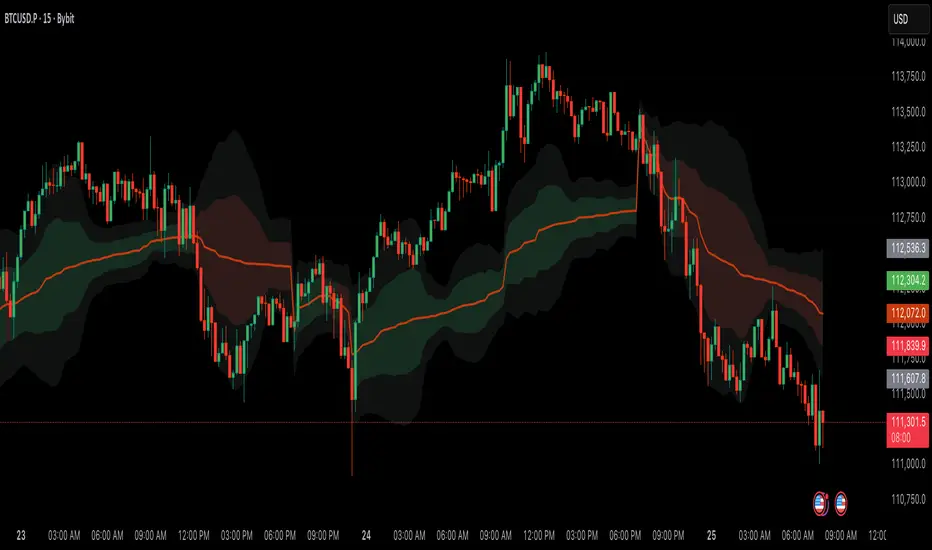
This script combines a Volume-Weighted Average Price (VWAP) baseline with standard deviation envelopes to create a dynamic "VWAP Cloud."
The VWAP itself is a widely used fair-value benchmark, showing where trading activity is most concentrated relative to price. By adding volatility-based bands around it, this tool helps traders visualize how far price has moved away from VWAP and whether those deviations may represent normal fluctuations or potential extremes.
🔎 How the Components Work Together
VWAP Midline (optional): Provides the session or rolling fair value reference.
Inner Cloud (±1 standard deviation by default): Highlights areas where price is oscillating near VWAP. This zone often reflects balanced conditions, where price is neither excessively stretched nor deeply discounted relative to volume-weighted value.
Outer Cloud (±2 standard deviations by default): Marks wider volatility extremes. These can be used to study how price reacts to statistically significant deviations from VWAP—whether by consolidating, reverting, or extending trends.
Dynamic Coloring: The cloud adjusts color based on VWAP slope. A rising VWAP is shaded green, suggesting positive momentum, while a falling VWAP is shaded red, suggesting negative momentum. Neutral gray highlights the outer envelope to distinguish extreme zones.
⚙️ Inputs & Customization
Source: Select the price type for VWAP calculation (default: hlc3).
Session Reset: Choose between daily resetting VWAP (common for intraday strategies) or a rolling VWAP (continuous view).
Standard Deviation Lookback: Controls the sample window for volatility calculation.
Band Multipliers: Adjust the width of inner and outer clouds.
Midline Toggle: Show or hide the VWAP midline depending on chart preference.
Custom Colors: Configure bullish, bearish, and neutral shading to match your charting style.
📊 How to Use
Trend Context: Price trading above VWAP generally suggests bullish conditions, while trading below suggests bearish conditions.
Value Zones: The inner cloud helps visualize short-term balance around VWAP.
Volatility Extremes: The outer cloud highlights statistically stretched moves that traders may analyze for either continuation or mean-reversion opportunities.
Scalping, Day Trading, Swing Trading: The tool adapts to different styles, depending on whether you reset VWAP each session or use the rolling version.
⚠️ Notes
This script is for educational purposes only and should be combined with other confluence factors, proper risk management, and a trading plan.
It does not generate buy/sell signals on its own. Instead, it provides a framework to study price behavior relative to a dynamic VWAP-based fair value.
Please clean your chart of unrelated drawings/indicators before applying, so the plotted clouds and midline remain clear.
– Dynamic Fair Value Zones with Standard Deviation Envelopes
This script combines a Volume-Weighted Average Price (VWAP) baseline with standard deviation envelopes to create a dynamic "VWAP Cloud."
The VWAP itself is a widely used fair-value benchmark, showing where trading activity is most concentrated relative to price. By adding volatility-based bands around it, this tool helps traders visualize how far price has moved away from VWAP and whether those deviations may represent normal fluctuations or potential extremes.
🔎 How the Components Work Together
VWAP Midline (optional): Provides the session or rolling fair value reference.
Inner Cloud (±1 standard deviation by default): Highlights areas where price is oscillating near VWAP. This zone often reflects balanced conditions, where price is neither excessively stretched nor deeply discounted relative to volume-weighted value.
Outer Cloud (±2 standard deviations by default): Marks wider volatility extremes. These can be used to study how price reacts to statistically significant deviations from VWAP—whether by consolidating, reverting, or extending trends.
Dynamic Coloring: The cloud adjusts color based on VWAP slope. A rising VWAP is shaded green, suggesting positive momentum, while a falling VWAP is shaded red, suggesting negative momentum. Neutral gray highlights the outer envelope to distinguish extreme zones.
⚙️ Inputs & Customization
Source: Select the price type for VWAP calculation (default: hlc3).
Session Reset: Choose between daily resetting VWAP (common for intraday strategies) or a rolling VWAP (continuous view).
Standard Deviation Lookback: Controls the sample window for volatility calculation.
Band Multipliers: Adjust the width of inner and outer clouds.
Midline Toggle: Show or hide the VWAP midline depending on chart preference.
Custom Colors: Configure bullish, bearish, and neutral shading to match your charting style.
📊 How to Use
Trend Context: Price trading above VWAP generally suggests bullish conditions, while trading below suggests bearish conditions.
Value Zones: The inner cloud helps visualize short-term balance around VWAP.
Volatility Extremes: The outer cloud highlights statistically stretched moves that traders may analyze for either continuation or mean-reversion opportunities.
Scalping, Day Trading, Swing Trading: The tool adapts to different styles, depending on whether you reset VWAP each session or use the rolling version.
⚠️ Notes
This script is for educational purposes only and should be combined with other confluence factors, proper risk management, and a trading plan.
It does not generate buy/sell signals on its own. Instead, it provides a framework to study price behavior relative to a dynamic VWAP-based fair value.
Please clean your chart of unrelated drawings/indicators before applying, so the plotted clouds and midline remain clear.
نص برمجي محمي
تم نشر هذا النص البرمجي كمصدر مغلق. ومع ذلك، يمكنك استخدامه بحرية ودون أي قيود - تعرف على المزيد هنا.
إخلاء المسؤولية
لا يُقصد بالمعلومات والمنشورات أن تكون، أو تشكل، أي نصيحة مالية أو استثمارية أو تجارية أو أنواع أخرى من النصائح أو التوصيات المقدمة أو المعتمدة من TradingView. اقرأ المزيد في شروط الاستخدام.