OPEN-SOURCE SCRIPT
Fractal Chaos Oscillator Strategy
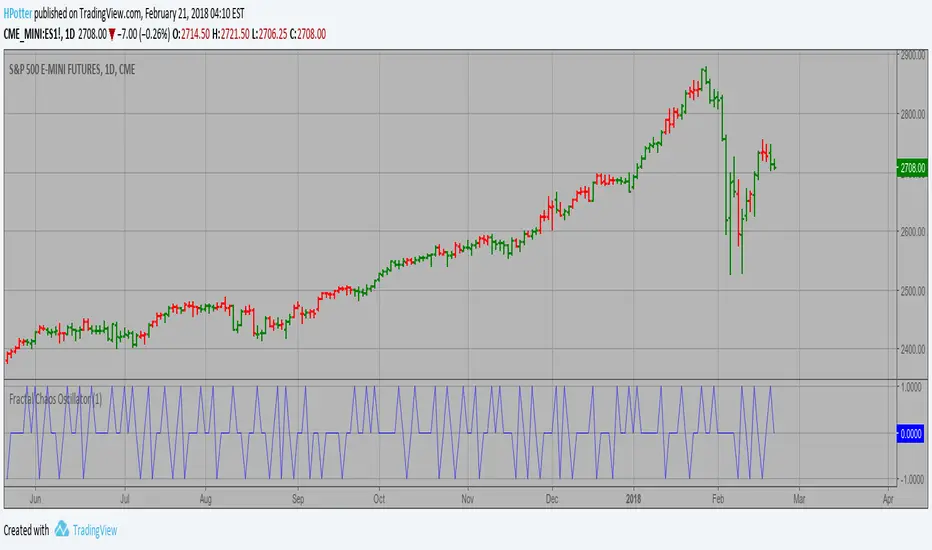
The value of Fractal Chaos Oscillator is calculated as the difference between
the most subtle movements of the market. In general, its value moves between
-1.000 and 1.000. The higher the value of the Fractal Chaos Oscillator, the
more one can say that it follows a certain trend – an increase in prices trend,
or a decrease in prices trend.
Being an indicator expressed in a numeric value, traders say that this is an
indicator that puts a value on the trendiness of the markets. When the FCO reaches
a high value, they initiate the “buy” operation, contrarily when the FCO reaches a
low value, they signal the “sell” action. This is an excellent indicator to use in
intra-day trading.
WARNING:
- This script to change bars colors.
نص برمجي مفتوح المصدر
بروح TradingView الحقيقية، قام مبتكر هذا النص البرمجي بجعله مفتوح المصدر، بحيث يمكن للمتداولين مراجعة وظائفه والتحقق منها. شكرا للمؤلف! بينما يمكنك استخدامه مجانًا، تذكر أن إعادة نشر الكود يخضع لقواعد الموقع الخاصة بنا.
إخلاء المسؤولية
لا يُقصد بالمعلومات والمنشورات أن تكون، أو تشكل، أي نصيحة مالية أو استثمارية أو تجارية أو أنواع أخرى من النصائح أو التوصيات المقدمة أو المعتمدة من TradingView. اقرأ المزيد في شروط الاستخدام.