OPEN-SOURCE SCRIPT
ICT Killzone Boxes

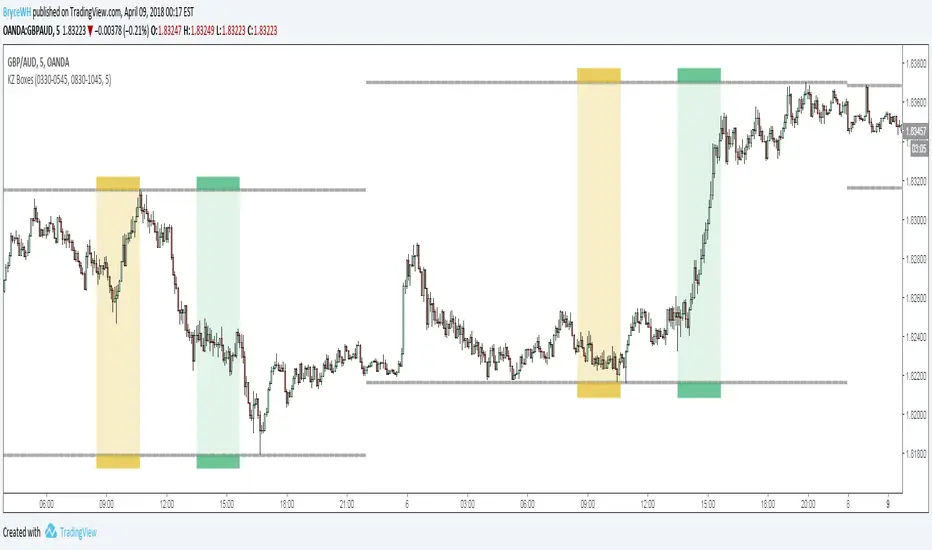
Plots London Open Killzone and New York Open Killzone as overlay boxes using current daily high / lows. Boxes verticle location will move as days range / high and low widens.
Middle fills can be turned on and off. Created this indicator because i didnt like highlighting the whole chart background as seen in other ICT Killzone indicators on tradingview and wanted something visually clearer.
If you want additional killzones such as london close / new york close, add the indicator to the chart twice.
Boxes height can be changed. Positive number puts the box outside current days high and low, negative number puts box inside current days high and low.
Adapted from Chris Moody's original indicator HLOC
Sorry for my ugly code. Presented as is - feel free to tweak / modify and change.
نص برمجي مفتوح المصدر
بروح TradingView الحقيقية، قام مبتكر هذا النص البرمجي بجعله مفتوح المصدر، بحيث يمكن للمتداولين مراجعة وظائفه والتحقق منها. شكرا للمؤلف! بينما يمكنك استخدامه مجانًا، تذكر أن إعادة نشر الكود يخضع لقواعد الموقع الخاصة بنا.
إخلاء المسؤولية
لا يُقصد بالمعلومات والمنشورات أن تكون، أو تشكل، أي نصيحة مالية أو استثمارية أو تجارية أو أنواع أخرى من النصائح أو التوصيات المقدمة أو المعتمدة من TradingView. اقرأ المزيد في شروط الاستخدام.