PROTECTED SOURCE SCRIPT
SuperTrend副图趋势精准买卖点
Indicator Name / 指标名称:
副图趋势精准买卖点
Sub-chart Trend Precision Buy-Sell Points
Core Function / 核心功能:
本指标是一款强大的趋势跟踪与交易信号工具,旨在通过独特的算法模型,为投资者精准捕捉市场中的关键买卖时机。它通过多空动能的可视化对比,清晰揭示当前趋势的强弱转换,并辅以明确的信号提示,帮助您在复杂的行情中做出更理性的决策。
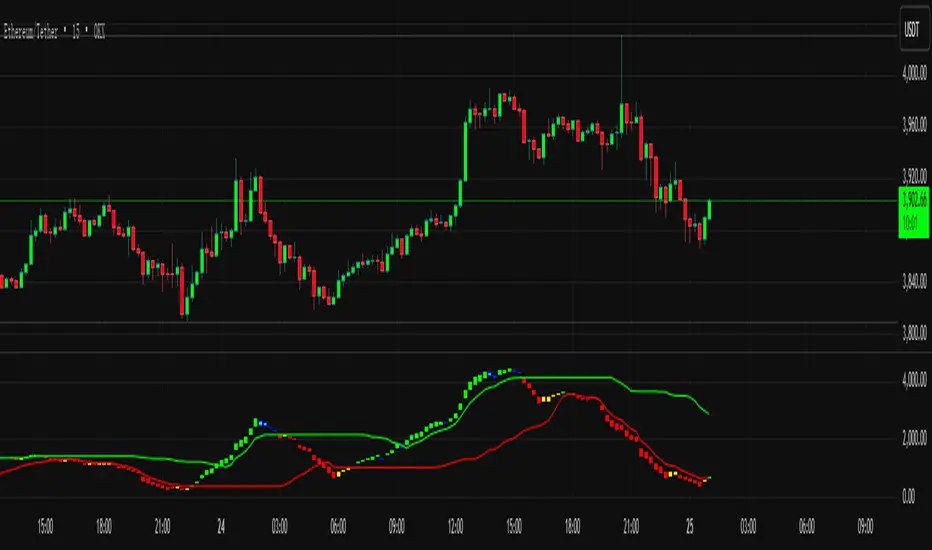
This indicator is a powerful trend-following and trading signal tool designed to use a unique algorithmic model to help investors precisely capture key buying and selling opportunities in the market. Through the visual comparison of bullish and bearish momentum, it clearly reveals the strength transitions of the current trend and provides clear signal alerts, assisting you in making more rational decisions within complex market conditions.
Main Features / 主要特点:
Visualized Bullish-Bearish Momentum / 多空动能可视化:
通过鲜明的红绿双色柱状图,直观展示市场多空力量的实时博弈情况,让趋势方向一目了然。
Uses distinct red and green histogram bars to intuitively display the real-time battle between bullish and bearish forces in the market, making the trend direction clear at a glance.
Precise Buy-Sell Signals / 精准买卖信号:
在趋势发生关键转折点时,指标会发出独特的信号提示(如青色和黄色标记),为您提供潜在的入场和出场参考。
When key turning points occur in the trend, the indicator triggers unique signal prompts (such as cyan and yellow markers), providing you with potential entry and exit references.
Dynamic Support and Resistance Lines / 动态支撑压力线:
内嵌动态的支撑线与压力线,能够随市场波动自适应调整,帮助您识别关键的阻力位和支撑位,为判断行情空间提供重要依据。
Incorporates dynamic support and resistance lines that adaptively adjust with market fluctuations, helping you identify key resistance and support levels, which provides an important basis for judging market movement potential.
Simple, Intuitive, and Easy to Use / 简洁直观,易于使用:
所有信号均以图形化方式呈现于副图,界面清晰简洁,无需复杂解读,新手也能快速上手。
All signals are presented graphically on the sub-chart. The interface is clear and concise, requiring no complex interpretation, allowing even beginners to get started quickly.
Applicable Scenarios / 适用场景:
适用于寻找趋势启动点及转折点的投资者。
Suitable for investors looking for trend initiation points and turning points.
适用于需要辅助判断市场多空动能强弱的交易者。
Suitable for traders who need assistance in judging the strength of market bullish/bearish momentum.
可作为您现有交易系统中的一个有效确认工具。
Can serve as an effective confirmation tool within your existing trading system.
Friendly Reminder / 温馨提示:
任何技术指标均为分析辅助工具,建议结合其他分析方法或自身交易经验综合判断,市场有风险,投资需谨慎。
Any technical indicator is an auxiliary analysis tool. It is recommended to use it in combination with other analysis methods or your own trading experience for comprehensive judgment. The market carries risks, so investment requires caution.
副图趋势精准买卖点
Sub-chart Trend Precision Buy-Sell Points
Core Function / 核心功能:
本指标是一款强大的趋势跟踪与交易信号工具,旨在通过独特的算法模型,为投资者精准捕捉市场中的关键买卖时机。它通过多空动能的可视化对比,清晰揭示当前趋势的强弱转换,并辅以明确的信号提示,帮助您在复杂的行情中做出更理性的决策。
This indicator is a powerful trend-following and trading signal tool designed to use a unique algorithmic model to help investors precisely capture key buying and selling opportunities in the market. Through the visual comparison of bullish and bearish momentum, it clearly reveals the strength transitions of the current trend and provides clear signal alerts, assisting you in making more rational decisions within complex market conditions.
Main Features / 主要特点:
Visualized Bullish-Bearish Momentum / 多空动能可视化:
通过鲜明的红绿双色柱状图,直观展示市场多空力量的实时博弈情况,让趋势方向一目了然。
Uses distinct red and green histogram bars to intuitively display the real-time battle between bullish and bearish forces in the market, making the trend direction clear at a glance.
Precise Buy-Sell Signals / 精准买卖信号:
在趋势发生关键转折点时,指标会发出独特的信号提示(如青色和黄色标记),为您提供潜在的入场和出场参考。
When key turning points occur in the trend, the indicator triggers unique signal prompts (such as cyan and yellow markers), providing you with potential entry and exit references.
Dynamic Support and Resistance Lines / 动态支撑压力线:
内嵌动态的支撑线与压力线,能够随市场波动自适应调整,帮助您识别关键的阻力位和支撑位,为判断行情空间提供重要依据。
Incorporates dynamic support and resistance lines that adaptively adjust with market fluctuations, helping you identify key resistance and support levels, which provides an important basis for judging market movement potential.
Simple, Intuitive, and Easy to Use / 简洁直观,易于使用:
所有信号均以图形化方式呈现于副图,界面清晰简洁,无需复杂解读,新手也能快速上手。
All signals are presented graphically on the sub-chart. The interface is clear and concise, requiring no complex interpretation, allowing even beginners to get started quickly.
Applicable Scenarios / 适用场景:
适用于寻找趋势启动点及转折点的投资者。
Suitable for investors looking for trend initiation points and turning points.
适用于需要辅助判断市场多空动能强弱的交易者。
Suitable for traders who need assistance in judging the strength of market bullish/bearish momentum.
可作为您现有交易系统中的一个有效确认工具。
Can serve as an effective confirmation tool within your existing trading system.
Friendly Reminder / 温馨提示:
任何技术指标均为分析辅助工具,建议结合其他分析方法或自身交易经验综合判断,市场有风险,投资需谨慎。
Any technical indicator is an auxiliary analysis tool. It is recommended to use it in combination with other analysis methods or your own trading experience for comprehensive judgment. The market carries risks, so investment requires caution.
نص برمجي محمي
تم نشر هذا النص البرمجي كمصدر مغلق. ومع ذلك، يمكنك استخدامه بحرية ودون أي قيود - تعرف على المزيد هنا.
إخلاء المسؤولية
لا يُقصد بالمعلومات والمنشورات أن تكون، أو تشكل، أي نصيحة مالية أو استثمارية أو تجارية أو أنواع أخرى من النصائح أو التوصيات المقدمة أو المعتمدة من TradingView. اقرأ المزيد في شروط الاستخدام.