Trendfilter AD1
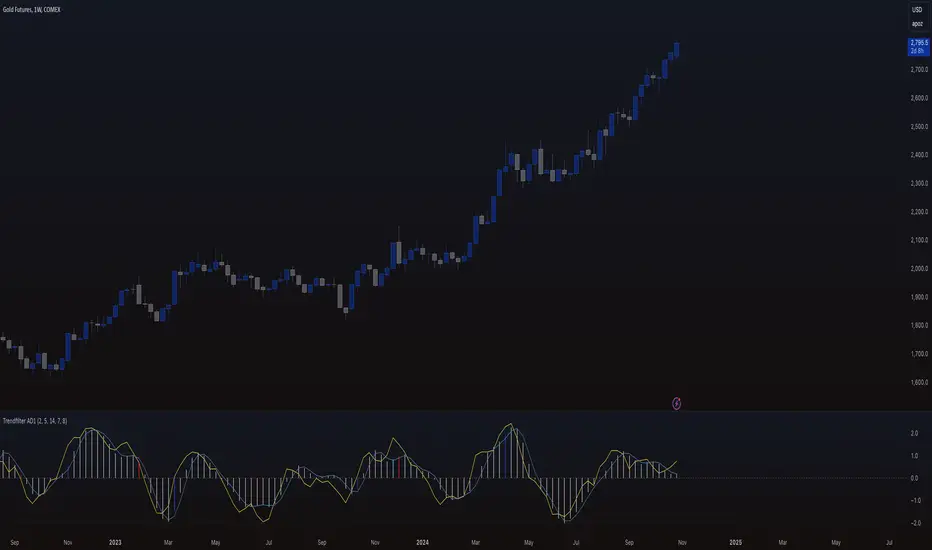
The "Trendfilter AD1" indicator is a versatile tool for trend detection that combines volume changes, price ranges, ATR (Average True Range), and moving averages. It also considers the momentum of True High/Low over a specified period (PROFF). The indicator integrates various mathematical calculations to measure market trends and volatility. Key features include the use of Powerbar colors, which indicate significant activity from large market participants.
Trendfilter LW
The Trendfilter LW section of the script calculates trend strength by comparing short-term and long-term simple moving averages (SMA) of closing prices, and by assessing cumulative price differences. The result is displayed as a histogram, with positive values indicating bullish trends and negative values indicating bearish trends. This helps traders visualize the strength and direction of long-term and short-term trends.
Trendfilter SP
The Trendfilter SP section combines volume changes, ATR data, and Z-score calculations to smooth out trend signals and provide a clearer assessment of market trends. It uses these data points to filter out noise and highlight significant trend changes. The combined Z-score, smoothed by an EMA, offers precise trend indications and helps traders identify whether the prevailing market forces are bullish or bearish.
What is it for?
The indicator helps traders identify trends and assess market volatility. By combining volume and price movements, it highlights potential trend reversals and shifts in market strength. The calculation of True High/Low (PROFF) measures market momentum over a set period, providing insights into price dynamics. The indicator also uses color-coded bars to represent different levels of market activity and trend strength, with Powerbar colors specifically highlighting major market moves driven by large traders.
How is it used?
Traders can customize the indicator through settings such as Volume Change Periods, EMA periods, and the True High/Low period (PROFF). The indicator generates signals based on significant volume and price fluctuations, with trends displayed through color-coded bars. The Trendfilter LW section calculates trend strength using SMA and cumulative price differences, while the Trendfilter SP section combines volume and ATR data with Z-score calculations to smooth out trend signals. These elements together provide a clear picture of market direction and strength.
نص برمجي للمستخدمين المدعوين فقط
يمكن فقط للمستخدمين الذين تمت الموافقة عليهم من قبل المؤلف الوصول إلى هذا البرنامج النصي. ستحتاج إلى طلب الإذن والحصول عليه لاستخدامه. يتم منح هذا عادةً بعد الدفع. لمزيد من التفاصيل، اتبع تعليمات المؤلف أدناه أو اتصل ب ComJoTrader مباشرة.
لا توصي TradingView بالدفع مقابل برنامج نصي أو استخدامه إلا إذا كنت تثق تمامًا في مؤلفه وتفهم كيفية عمله. يمكنك أيضًا العثور على بدائل مجانية ومفتوحة المصدر في نصوص مجتمعنا.
تعليمات المؤلف
إخلاء المسؤولية
نص برمجي للمستخدمين المدعوين فقط
يمكن فقط للمستخدمين الذين تمت الموافقة عليهم من قبل المؤلف الوصول إلى هذا البرنامج النصي. ستحتاج إلى طلب الإذن والحصول عليه لاستخدامه. يتم منح هذا عادةً بعد الدفع. لمزيد من التفاصيل، اتبع تعليمات المؤلف أدناه أو اتصل ب ComJoTrader مباشرة.
لا توصي TradingView بالدفع مقابل برنامج نصي أو استخدامه إلا إذا كنت تثق تمامًا في مؤلفه وتفهم كيفية عمله. يمكنك أيضًا العثور على بدائل مجانية ومفتوحة المصدر في نصوص مجتمعنا.