OPEN-SOURCE SCRIPT
تم تحديثه Volume Zone Oscillator by [VanHelsig]
Volume Zone Oscillator
How volume zone oscillator work:
Like other VZO it uses the same principle of calculation Volume direction divided on total volume and then scaled to 100 and -100.
When we have positive momentum close > close[loockback] we have value of positive Volume, other way we have -volume negative one. <- this called a volume direction
Total volume is simply moving average with source of volume
And then MA with source of volume direction divided on MA of total colume and scaled it from 100 to -100
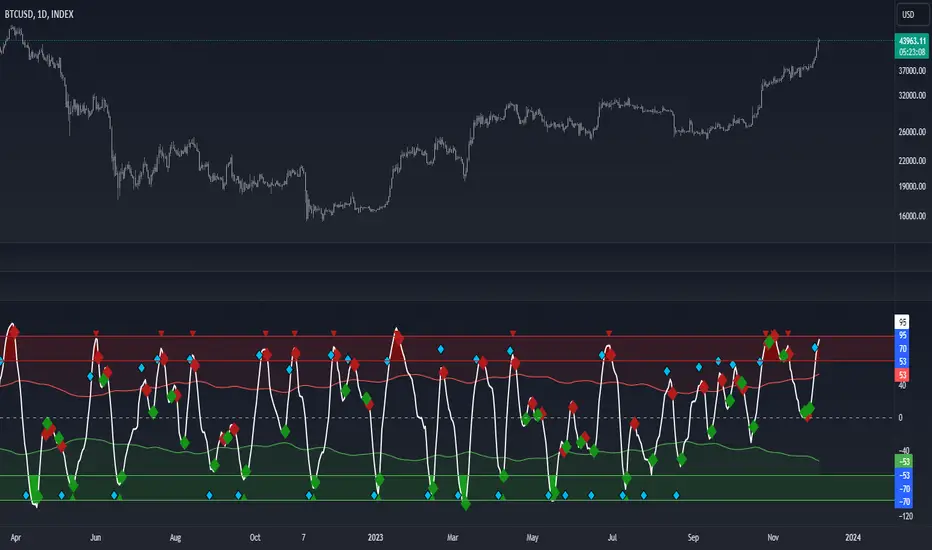
Basically we have few signals what VZO can show:
-Strong buy in oversold zone and strong sell in overbought zone. (Triangles at the top red and at the bottom green)
-Local Buy and Sell (Green and red Robustnesses)
-Posibility of trend change (Blue robustness)
Also you can webhook alerts to your spread sheet that sends values 1 for buys signals and -1 for sell signals in a range of 1 to 10 days
Here you can see marked signals on the chart

How volume zone oscillator work:
Like other VZO it uses the same principle of calculation Volume direction divided on total volume and then scaled to 100 and -100.
When we have positive momentum close > close[loockback] we have value of positive Volume, other way we have -volume negative one. <- this called a volume direction
Total volume is simply moving average with source of volume
And then MA with source of volume direction divided on MA of total colume and scaled it from 100 to -100
Basically we have few signals what VZO can show:
-Strong buy in oversold zone and strong sell in overbought zone. (Triangles at the top red and at the bottom green)
-Local Buy and Sell (Green and red Robustnesses)
-Posibility of trend change (Blue robustness)
Also you can webhook alerts to your spread sheet that sends values 1 for buys signals and -1 for sell signals in a range of 1 to 10 days
Here you can see marked signals on the chart
ملاحظات الأخبار
Updated calculations and backtested. ملاحظات الأخبار
-ملاحظات الأخبار
BackTest BTC Index (BackTest of local buys and local sells) BackTest ETH Index
https://www.tradingview.com/x/Dxb8cWuv/
ملاحظات الأخبار
Organazide code, changed default inputsنص برمجي مفتوح المصدر
بروح TradingView الحقيقية، قام مبتكر هذا النص البرمجي بجعله مفتوح المصدر، بحيث يمكن للمتداولين مراجعة وظائفه والتحقق منها. شكرا للمؤلف! بينما يمكنك استخدامه مجانًا، تذكر أن إعادة نشر الكود يخضع لقواعد الموقع الخاصة بنا.
إخلاء المسؤولية
لا يُقصد بالمعلومات والمنشورات أن تكون، أو تشكل، أي نصيحة مالية أو استثمارية أو تجارية أو أنواع أخرى من النصائح أو التوصيات المقدمة أو المعتمدة من TradingView. اقرأ المزيد في شروط الاستخدام.
نص برمجي مفتوح المصدر
بروح TradingView الحقيقية، قام مبتكر هذا النص البرمجي بجعله مفتوح المصدر، بحيث يمكن للمتداولين مراجعة وظائفه والتحقق منها. شكرا للمؤلف! بينما يمكنك استخدامه مجانًا، تذكر أن إعادة نشر الكود يخضع لقواعد الموقع الخاصة بنا.
إخلاء المسؤولية
لا يُقصد بالمعلومات والمنشورات أن تكون، أو تشكل، أي نصيحة مالية أو استثمارية أو تجارية أو أنواع أخرى من النصائح أو التوصيات المقدمة أو المعتمدة من TradingView. اقرأ المزيد في شروط الاستخدام.