PROTECTED SOURCE SCRIPT
تم تحديثه Cycle Theory + Frequency Theory
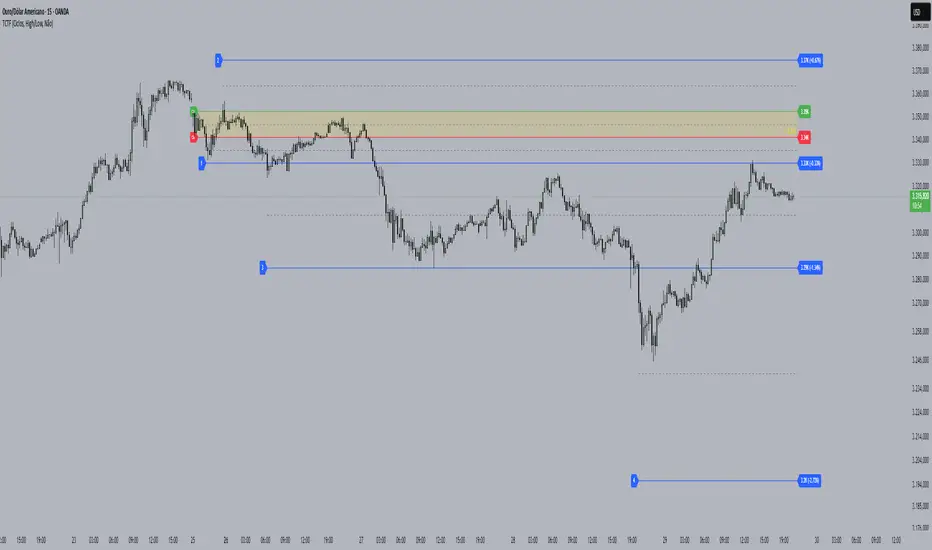
Cycle Theory attempts to predict, through volatility, support/resistance points where the market may reach/reverse a trend. This theory's calculation is based on a reference candle that the user chooses, usually the first candle of the day/week's session. From this point on, if the level is broken upwards or downwards, the 1st Cycle begins with the same distance between the high/low or open/close of the reference candle. From the 2nd Cycle onwards, the size becomes the sum of all the last cycles formed, and so on.
Frequency Theory is similar, but its levels always have the same size as the high/low or open/close of the reference candle.
Frequency Theory is similar, but its levels always have the same size as the high/low or open/close of the reference candle.
ملاحظات الأخبار
code improvements and bug fixes for displaying cycle 1 and 2ملاحظات الأخبار
code improvements and added breakout alert function* In addition to activating this function in the indicator, it is necessary to configure TradingView's own alert system by selecting this indicator as the alert source.
ملاحظات الأخبار
code improvementsملاحظات الأخبار
Added two new functions:- Possibility to slice the CA (Opening Channel) by 50% if it is too large
- Color the CA background for better visualization
ملاحظات الأخبار
Added function:Now you can set prices manually to start the markup
- Bug fix in CA slice function
- Code improvements
ملاحظات الأخبار
- Change in the division calculation of the CA slice function- Code improvements
ملاحظات الأخبار
Major update!Added new functions:
Automatic Anchoring - Now you can select a timeframe in which you want to anchor the CA without having to configure it manually. For example, anchor the CA at each new start of a weekly session.
Dynamic CA - Function that uses a mathematical metric to define the size of the CA. We can choose which timeframe and how many candles behind the current one the indicator should calculate the average of the High/Low or Close to determine the size of the CA. In other words, this CA will be based on the price movement in the chosen period.
The layout has been organized to make the functions easy to understand. Click on the "i" icon next to the functions to understand more about them.
Code improvements
PS: The indicator installation is configured with the default system of the cycle theory.
However, with this new update, it is possible to create some other similar technique (maybe even better than the original) or improve it
ملاحظات الأخبار
Fixed level expansion in the Frequency optionCode improvements
ملاحظات الأخبار
Adjustments and corrections to the level projection equationsAdded the option to use an arithmetic or logarithmic scale to calculate levels
Code improvements
ملاحظات الأخبار
Bug fixes in the scale functionCode improvements
ملاحظات الأخبار
Added more levels for projectionCode improvements
ملاحظات الأخبار
Added function to project levels in frequency mode before price breaksملاحظات الأخبار
Fixed a bug in using certain timeframe configurations when the Auto Anchor and Dynamic CA options are active and working together.Added calculation options and others improvements to the Dynamic CA function.
Added a function to color candles in two different models: Standard and PVSRA.
Reorganized color customization in the layout.
Code improvements.
نص برمجي محمي
تم نشر هذا النص البرمجي كمصدر مغلق. ومع ذلك، يمكنك استخدامه بحرية ودون أي قيود - تعرف على المزيد هنا.
إخلاء المسؤولية
لا يُقصد بالمعلومات والمنشورات أن تكون، أو تشكل، أي نصيحة مالية أو استثمارية أو تجارية أو أنواع أخرى من النصائح أو التوصيات المقدمة أو المعتمدة من TradingView. اقرأ المزيد في شروط الاستخدام.