PROTECTED SOURCE SCRIPT
HaP Hibrid S/D
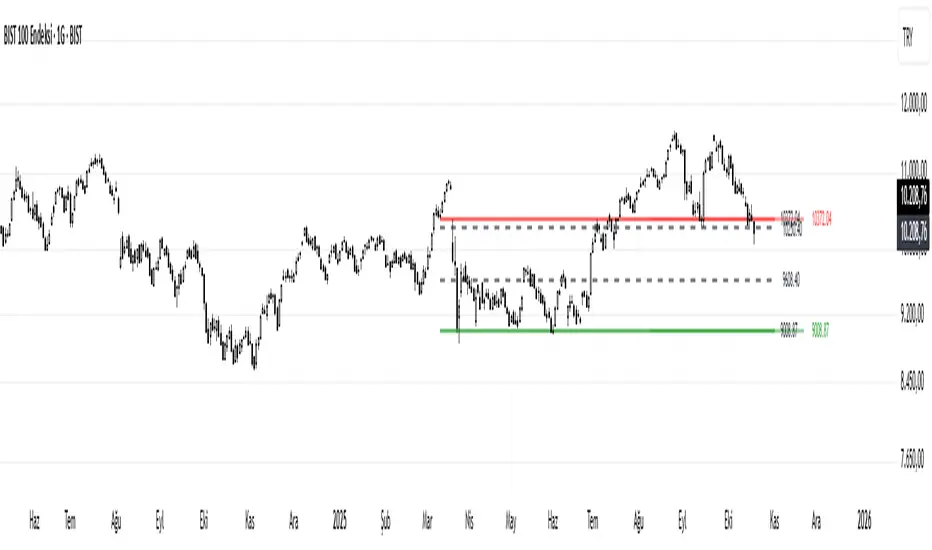
This code is a technical analysis indicator named "HaP Hybrid S/D," developed using Pine Script v5. It is a comprehensive and customizable tool designed to identify support and resistance (S/R) levels, detect order blocks, and analyze market dynamics in financial markets. The code combines adaptive and machine learning (ML)-based systems to offer a hybrid approach, supporting various chart types and multi-timeframe analysis. Below, I detail the core, standout, and superior features of the code:Core FeaturesMulti-Chart Type Support:The indicator allows users to analyze price charts in TRY, USD, or Composite (stock/index ratio) formats.
Users can select line or candlestick chart types, enabling customized visualization based on their needs.
The composite chart analyzes relative performance by dividing stock prices by the BIST XU100 index, while the USD-based chart accounts for exchange rate effects.
Support and Resistance Detection:Adaptive System: Dynamically calculates pivot points (based on high/low or close prices) and automatically adjusts to market conditions (trend, consolidation, volatility).
ML-Based System: Uses machine learning to cluster pivot points (average linkage clustering) and identify the most significant support/resistance levels.
Users can choose to display only the nearest S/R levels or all levels.
Order Block Detection:Identifies buy and sell order blocks using volume and price movement (ATR-based) analysis.
Blocks are filtered based on user-defined minimum volume thresholds and ATR multipliers.
Buy (green) and sell (red) blocks are drawn and labeled for visualization.
Multi-Timeframe Support:Analyzes and draws pivot levels across 4-hour (H4), daily (D1), and weekly (W1) timeframes.
Users can customize these levels with different line styles (solid, dashed, dotted) and thicknesses.
User-Friendly Interface:The indicator is configurable with multiple setting groups (chart selection, order blocks, S/R, color settings, etc.).
Users can customize line thicknesses, label sizes, transparency levels, and colors.
Standout FeaturesHybrid Approach (Adaptive + ML):The indicator combines adaptive and machine learning-based systems to offer a unique hybrid model. Users can choose to use only adaptive, only ML-based, or both systems.
Adaptive System: Dynamically adjusts pivot calculation parameters based on technical indicators like market volatility, trend strength, and ADX.
ML-Based System: Clusters pivot points (similar to k-means with average linkage) to identify the strongest support/resistance levels and optimizes them using silhouette scores.
Dynamic Pivot Memory:In the ML system, pivot memory is automatically adjusted based on volume, trend, and time factors. For example, shorter memory is used in high-volatility periods, while longer memory is preferred in low-volatility periods.
Users can manually set pivot memory or opt for automatic adjustment.
Fibonacci Integration:Fibonacci retracement levels (0, 0.236, 0.382, 0.5, 0.618, 0.786, 1) can be calculated and integrated with support/resistance levels.
Fibonacci tolerance is dynamically adjusted based on volatility and ATR for more precise levels.
Market Condition Analysis:The indicator automatically detects market conditions (consolidation, trend, volatile market) and optimizes S/R calculation parameters accordingly.
Technical indicators such as ATR, RSI, ADX, MACD, and Bollinger Bands are used to analyze market dynamics.
Management of Broken Levels:Broken support/resistance levels can be automatically hidden (optional).
Order blocks and S/R zones are cleared when the price breaks these levels, ensuring only relevant levels are displayed.
Superior FeaturesAdvanced Visualization:Support and resistance levels are drawn with user-defined colors, transparency, and line styles. Price labels make it easier to track levels.
Order blocks are clearly marked, with the number of historical blocks limitable by the user.
Automatic Optimization:In the ML system, the optimal number of clusters and pivot memory is automatically determined using silhouette scores and level effectiveness scores.
In the adaptive system, pivot calculation parameters (left/right bar count, level length, etc.) are dynamically optimized based on volatility ratio, trend strength, and ADX.
Volume and Trend-Based Analysis:Volume thresholds and ATR multipliers enhance the accuracy of order block detection.
Trend strength (calculated using EMAs and ROC) and volatility ratio improve the precision of S/R levels.
Flexible Timeframe Integration:Multi-timeframe analysis provides a broader market perspective, displaying S/R levels from different timeframes together.
The lookahead feature ensures more accurate pivot detection in multi-timeframe calculations (can be optionally disabled).
Performance and Memory Management:The code is designed for performance with limits such as max_bars_back=3000, max_lines_count=500, and max_labels_count=500.
Unnecessary drawings are cleared, and array sizes are limited to ensure a smooth experience on the TradingView platform.
Use CasesShort-Term Traders: Can use the nearest support/resistance levels and order blocks in the current timeframe to make quick decisions.
Long-Term Investors: Can identify broader market trends and strong S/R levels through multi-timeframe analysis.
Technical Analysts: Can perform in-depth analysis with Fibonacci integration, market condition analysis, and ML-based clustering.
Visual Analysis Enthusiasts: Can achieve a clear and aesthetic chart appearance with customizable colors, labels, and line styles.
Conclusion
HaP Hybrid S/D is a powerful tool for both novice and professional traders in technical analysis. The combination of adaptive and ML-based systems ensures adaptability to dynamic market conditions, offering users a flexible analysis experience. Multi-timeframe support, Fibonacci integration, and comprehensive visualization options make this indicator a standout solution in the market. On the TradingView platform, particularly for stock and index analysis, it is an ideal tool to enhance decision-making processes.
نص برمجي محمي
تم نشر هذا النص البرمجي كمصدر مغلق. ومع ذلك، يمكنك استخدامه بحرية ودون أي قيود - تعرف على المزيد هنا.
إخلاء المسؤولية
لا يُقصد بالمعلومات والمنشورات أن تكون، أو تشكل، أي نصيحة مالية أو استثمارية أو تجارية أو أنواع أخرى من النصائح أو التوصيات المقدمة أو المعتمدة من TradingView. اقرأ المزيد في شروط الاستخدام.