PROTECTED SOURCE SCRIPT
Daily SMA Gate (Bear) + HS(15m & 1H RS) + Daily Upper BB
Daily SMA Bear Gate + HS (15m/1H) – Early Signal + Daily Upper BB
Purpose: a “sell the rip” scanner/indicator that looks for early right-shoulder completion of a standard Head & Shoulders (HS) on intraday charts (15m & 1H), but only when the daily context is bearish. Optional daily Upper Bollinger proximity lets you focus on rallies into resistance.
How it works
1) Daily Bear Gate (trend filter)
Uses the Daily timeframe.
Gate is true when:
Price is below the Daily SMA(50), and
Price is within X% of the Daily SMA(20) (configurable).
Option to use the prior completed daily bar only (no intraday bleed).
2) HS right-shoulder detector (early) on intraday
Runs on 15m and 1H via request.security.
Detects a standard HS using swing pivots:
Ordered pivots H1 (left shoulder), H2 higher high (head), H3 (right shoulder).
Right shoulder must be lower than the head and near H1 (ATR- or %-based tolerance).
Neckline is required: lowest swing-low strictly between H1 and H3.
Minimum bar separation between shoulders/head is configurable.
Signals fire as the right-shoulder pivot confirms (on the bar that completes R bars to the right of the pivot).
3) Daily Upper Bollinger filter (optional)
Daily basis = SMA(20); band = SMA(20) + k·σ (k default 1.0).
Prints 1 when Daily Close is within Y% of the upper band.
Useful to isolate “overbought rally into resistance” conditions.
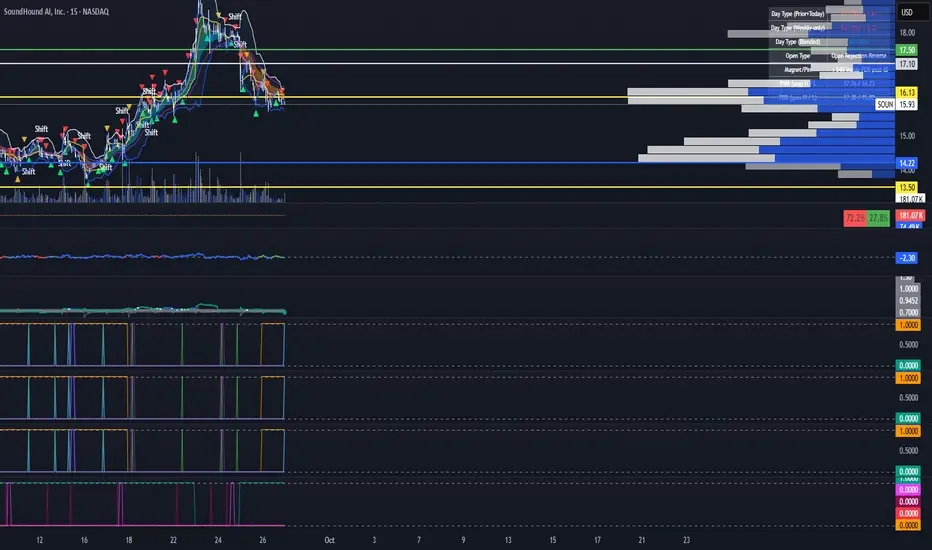
Plots / Screener columns
Combined HS Signal (15m OR 1H RS) – red (1 when Bear Gate is true and either TF confirms HS RS).
HS(15m Early) – maroon.
HS(1H Early) – fuchsia.
Daily SMA Bear Gate Only – orange (1 when below SMA50 and near SMA20).
Daily Upper Bollinger (within %) – teal (1 when within your % threshold of the upper band).
(Each line is 1 when true, 0 otherwise, so it works well in the Pine Screener.)
Inputs
Daily
SMA(50), SMA(20) lengths
“Within % of Daily SMA(20)”
“Use prior completed Daily bar only”
Bollinger
“Daily BB stdev (above SMA20)” (k)
“Within % of Daily Upper BB”
Pattern (HS)
Pivot L / R (pivot windows)
Min separation bars (H1–H2 and H2–H3)
Tolerance mode: ATR×mult or % of H1
How to use
Scan the watchlist with:
Daily SMA Bear Gate Only = 1, and
Daily Upper Bollinger (within %) = 1 (optional), and/or
Combined HS Signal (15m OR 1H) = 1 for entries.
Open the chart and inspect structure:
Confirm broader downtrend (below Daily 50-SMA).
Check that the right shoulder formed near the left shoulder and that a neckline exists between H1–H3.
Plan execution around your rules:
Many traders use the neckline or RS high for risk, and the neckline break/close for confirmation.
Notes & limitations
Pivot functions confirm only after R bars; before that, a potential pivot can disappear. Signals appear on confirmation (this is by design for “early RS” but avoids premature alerts).
Signals are timeframe-mixed: Daily for filters, 15m/1H for HS. Different markets/timeframes can produce different densities—tune L/R and tolerances to your instrument.
This is a discretionary tool, not financial advice. Always validate with your risk management and broader context (volume, higher-TF levels, news, etc.).
Purpose: a “sell the rip” scanner/indicator that looks for early right-shoulder completion of a standard Head & Shoulders (HS) on intraday charts (15m & 1H), but only when the daily context is bearish. Optional daily Upper Bollinger proximity lets you focus on rallies into resistance.
How it works
1) Daily Bear Gate (trend filter)
Uses the Daily timeframe.
Gate is true when:
Price is below the Daily SMA(50), and
Price is within X% of the Daily SMA(20) (configurable).
Option to use the prior completed daily bar only (no intraday bleed).
2) HS right-shoulder detector (early) on intraday
Runs on 15m and 1H via request.security.
Detects a standard HS using swing pivots:
Ordered pivots H1 (left shoulder), H2 higher high (head), H3 (right shoulder).
Right shoulder must be lower than the head and near H1 (ATR- or %-based tolerance).
Neckline is required: lowest swing-low strictly between H1 and H3.
Minimum bar separation between shoulders/head is configurable.
Signals fire as the right-shoulder pivot confirms (on the bar that completes R bars to the right of the pivot).
3) Daily Upper Bollinger filter (optional)
Daily basis = SMA(20); band = SMA(20) + k·σ (k default 1.0).
Prints 1 when Daily Close is within Y% of the upper band.
Useful to isolate “overbought rally into resistance” conditions.
Plots / Screener columns
Combined HS Signal (15m OR 1H RS) – red (1 when Bear Gate is true and either TF confirms HS RS).
HS(15m Early) – maroon.
HS(1H Early) – fuchsia.
Daily SMA Bear Gate Only – orange (1 when below SMA50 and near SMA20).
Daily Upper Bollinger (within %) – teal (1 when within your % threshold of the upper band).
(Each line is 1 when true, 0 otherwise, so it works well in the Pine Screener.)
Inputs
Daily
SMA(50), SMA(20) lengths
“Within % of Daily SMA(20)”
“Use prior completed Daily bar only”
Bollinger
“Daily BB stdev (above SMA20)” (k)
“Within % of Daily Upper BB”
Pattern (HS)
Pivot L / R (pivot windows)
Min separation bars (H1–H2 and H2–H3)
Tolerance mode: ATR×mult or % of H1
How to use
Scan the watchlist with:
Daily SMA Bear Gate Only = 1, and
Daily Upper Bollinger (within %) = 1 (optional), and/or
Combined HS Signal (15m OR 1H) = 1 for entries.
Open the chart and inspect structure:
Confirm broader downtrend (below Daily 50-SMA).
Check that the right shoulder formed near the left shoulder and that a neckline exists between H1–H3.
Plan execution around your rules:
Many traders use the neckline or RS high for risk, and the neckline break/close for confirmation.
Notes & limitations
Pivot functions confirm only after R bars; before that, a potential pivot can disappear. Signals appear on confirmation (this is by design for “early RS” but avoids premature alerts).
Signals are timeframe-mixed: Daily for filters, 15m/1H for HS. Different markets/timeframes can produce different densities—tune L/R and tolerances to your instrument.
This is a discretionary tool, not financial advice. Always validate with your risk management and broader context (volume, higher-TF levels, news, etc.).
نص برمجي محمي
تم نشر هذا النص البرمجي كمصدر مغلق. ومع ذلك، يمكنك استخدامه بحرية ودون أي قيود - تعرف على المزيد هنا.
إخلاء المسؤولية
لا يُقصد بالمعلومات والمنشورات أن تكون، أو تشكل، أي نصيحة مالية أو استثمارية أو تجارية أو أنواع أخرى من النصائح أو التوصيات المقدمة أو المعتمدة من TradingView. اقرأ المزيد في شروط الاستخدام.