OPEN-SOURCE SCRIPT
CCI RSI Trading Signal
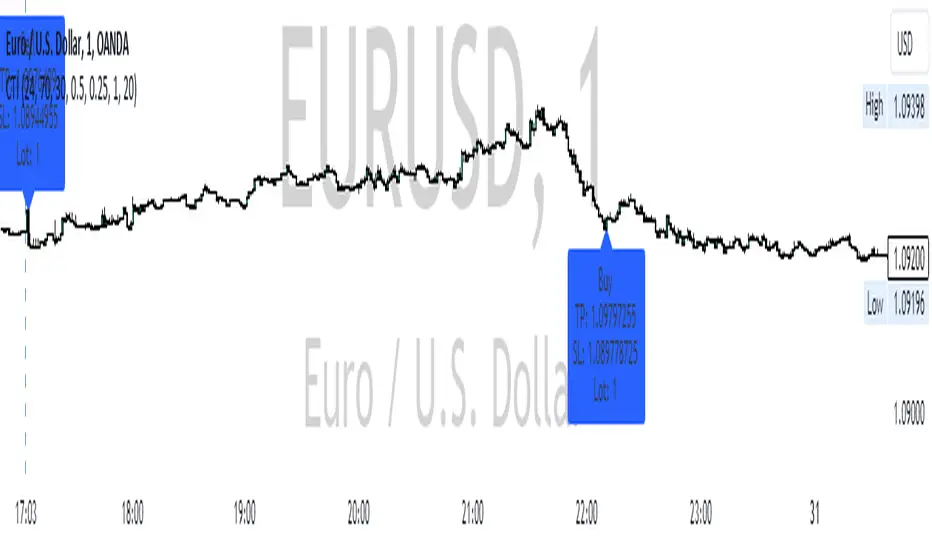
The "CCI RSI Trading Signal" indicator combines the Commodity Channel Index (CCI) and Relative Strength Index (RSI) to provide buy and sell signals for trading. The CCI identifies potential trend reversals, while the RSI helps confirm overbought and oversold conditions.
How It Works:
The indicator generates a buy signal when the CCI crosses above -100 (indicating a potential bullish reversal) and the RSI is below the specified oversold level. On the other hand, a sell signal is produced when the CCI crosses below 100 (indicating a potential bearish reversal) and the RSI is above the specified overbought level.
Customization:
Traders can adjust the RSI and CCI periods, RSI oversold and overbought levels, as well as take profit, stop loss, and lot size settings to suit their trading preferences.
Usage:
The "CCI RSI Trading Signal" indicator can be used on various timeframes and markets to aid in decision-making, providing potential entry and exit points based on the combined analysis of CCI and RSI.
نص برمجي مفتوح المصدر
بروح TradingView الحقيقية، قام مبتكر هذا النص البرمجي بجعله مفتوح المصدر، بحيث يمكن للمتداولين مراجعة وظائفه والتحقق منها. شكرا للمؤلف! بينما يمكنك استخدامه مجانًا، تذكر أن إعادة نشر الكود يخضع لقواعد الموقع الخاصة بنا.
إخلاء المسؤولية
لا يُقصد بالمعلومات والمنشورات أن تكون، أو تشكل، أي نصيحة مالية أو استثمارية أو تجارية أو أنواع أخرى من النصائح أو التوصيات المقدمة أو المعتمدة من TradingView. اقرأ المزيد في شروط الاستخدام.