OPEN-SOURCE SCRIPT
Bollinger Bands color candles

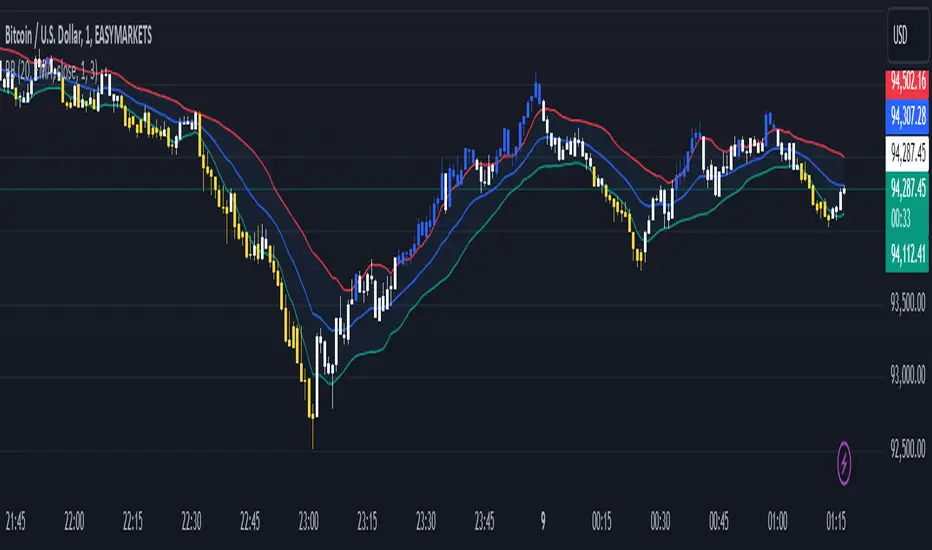
This Pine Script indicator applies Bollinger Bands to the price chart and visually highlights candles based on their proximity to the upper and lower bands. The script plots colored candles as follows:
Bullish Close Above Upper Band: Candles are colored green when the closing price is above the upper Bollinger Band, indicating strong bullish momentum.
Bearish Close Below Lower Band: Candles are colored red when the closing price is below the lower Bollinger Band, signaling strong bearish momentum.
Neutral Candles: Candles that close within the bands remain their default color.
This visual aid helps traders quickly identify potential breakout or breakdown points based on Bollinger Band dynamics.
نص برمجي مفتوح المصدر
بروح TradingView الحقيقية، قام مبتكر هذا النص البرمجي بجعله مفتوح المصدر، بحيث يمكن للمتداولين مراجعة وظائفه والتحقق منها. شكرا للمؤلف! بينما يمكنك استخدامه مجانًا، تذكر أن إعادة نشر الكود يخضع لقواعد الموقع الخاصة بنا.
إخلاء المسؤولية
لا يُقصد بالمعلومات والمنشورات أن تكون، أو تشكل، أي نصيحة مالية أو استثمارية أو تجارية أو أنواع أخرى من النصائح أو التوصيات المقدمة أو المعتمدة من TradingView. اقرأ المزيد في شروط الاستخدام.