OPEN-SOURCE SCRIPT
Pivots Support Resistance Zone
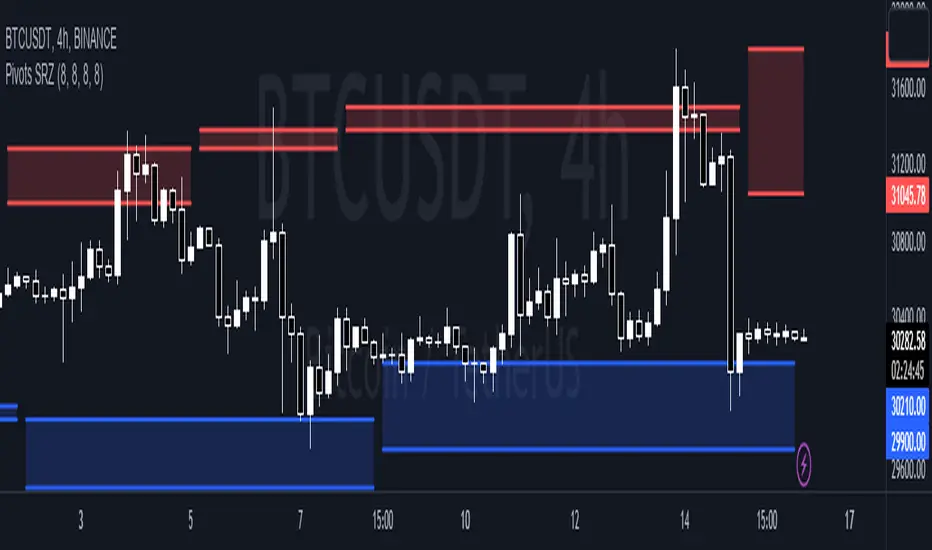
This simple script base on function of Pivot High Low to plot Support and Resistance Zone on chart with detail as below:
1. Support Zone
+ New Pivot Low is plotted
+ New Pivot Low lower previous Pivot Low
+ Upper Line of Support Zone is previous Pivot Low
+ Lower Line of Support Zone is new Pivot Low
2. Resistance Zone
+ New Pivot High is plotted
+ New Pivot High higher previous Pivot High
+ Upper Line of Resistance Zone is new Pivot High
+ Lower Line of Resistance Zone is previous Pivot High
نص برمجي مفتوح المصدر
بروح TradingView الحقيقية، قام مبتكر هذا النص البرمجي بجعله مفتوح المصدر، بحيث يمكن للمتداولين مراجعة وظائفه والتحقق منها. شكرا للمؤلف! بينما يمكنك استخدامه مجانًا، تذكر أن إعادة نشر الكود يخضع لقواعد الموقع الخاصة بنا.
إخلاء المسؤولية
لا يُقصد بالمعلومات والمنشورات أن تكون، أو تشكل، أي نصيحة مالية أو استثمارية أو تجارية أو أنواع أخرى من النصائح أو التوصيات المقدمة أو المعتمدة من TradingView. اقرأ المزيد في شروط الاستخدام.