INVITE-ONLY SCRIPT
Normalized MACD by[@hadi_saadat]
تم تحديثه
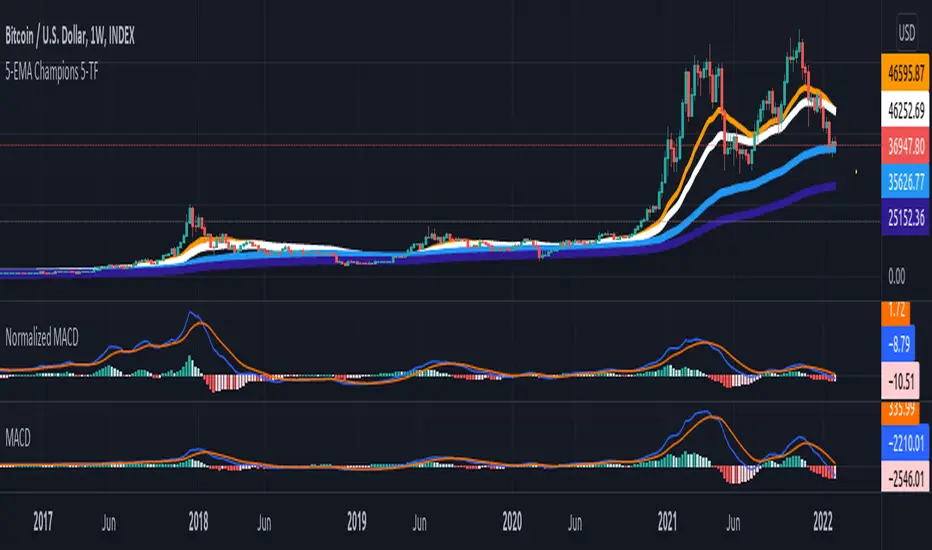
This MACD is exactly like standard MACD, but extremely stable and normalized by EMAs(200,150,100,50,30).
So you need at-least 30 candle to see the chart.
The Huge differences can be seen when the close price scale over time changes for instance go to the weekly time-frame, see the normalized MACD and Standard MACD when the BTC price was below 10k or even below 5k and compare two MACD charts (The standard one chart get almost vanished when the price was much cheaper and it doesnt scale well), then zoom in the standard MACD at that period and again compare it to The Normalized one(When you zoom in you will see surprisingly both MACDs are exactly the same form and shape, however normalized one doesn't need zoom-in and it is well scaled among the time and different prices), You will be surprised that how stable it is.
The normalizes MACDs, Signals and Histograms values are comparable to any other assets (obviously in same time-frame).
ملاحظات الأخبار
The default precision for indicator values is updated to 3.نص برمجي للمستخدمين المدعوين فقط
الوصول إلى هذا النص مقيد للمستخدمين المصرح لهم من قبل المؤلف وعادة ما يكون الدفع مطلوباً. يمكنك إضافته إلى مفضلاتك، لكن لن تتمكن من استخدامه إلا بعد طلب الإذن والحصول عليه من مؤلفه. تواصل مع hadi_saadat للحصول على مزيد من المعلومات، أو اتبع إرشادات المؤلف أدناه.
لا تقترح TradingView الدفع مقابل النصوص البرمجية واستخدامها حتى تثق بنسبة 100٪ في مؤلفها وتفهم كيفية عملها. في كثير من الحالات، يمكنك العثور على بديل جيد مفتوح المصدر مجانًا في نصوص مجتمع الخاصة بنا .
تعليمات المؤلف
″just comment here for your request.
هل تريد استخدام هذا النص البرمجي على الرسم البياني؟
تحذير: يرجى القراءة قبل طلب الوصول.
إخلاء المسؤولية
لا يُقصد بالمعلومات والمنشورات أن تكون، أو تشكل، أي نصيحة مالية أو استثمارية أو تجارية أو أنواع أخرى من النصائح أو التوصيات المقدمة أو المعتمدة من TradingView. اقرأ المزيد في شروط الاستخدام.