PROTECTED SOURCE SCRIPT
Cross-Asset Risk Appetite Index
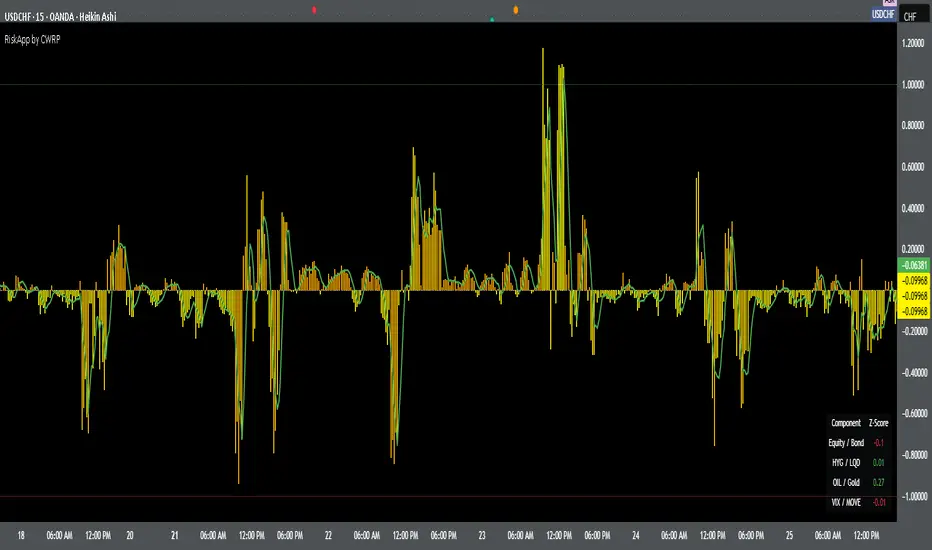
Cross-Asset Risk Appetite Index (RiskApp) by CWRP combines multiple asset classes into a single risk sentiment signal to help traders and investors detect when the market is in a risk-on or risk-off regime.
It calculates a composite Z-score index based on relative performance between:
SPY / IEF: Equities vs Bonds
HYG / LQD: High Yield vs Investment Grade Credit
CL / GC: Oil vs Gold
VIX / MOVE: Equity vs Bond Market Volatility (inverted)
Each component reflects capital flows toward riskier or safer assets, with dynamic weighting (Equity/Bond: 30%, Credit: 25%, Commodities: 25%, Volatility: 20%) and smoothing applied for a cleaner signal.
How to Read:
Highlighting
Yellow = Risk-On sentiment (market favors risk assets)
Orange = Risk-Off sentiment (flight to safety)
Black Background = Neutral design for emotional detachment
Table
Equity/Bond Z-Score:
Positive (> +1) --> Stocks outperforming bonds --> Risk-On
Negative (< -1) --> Bonds outperforming stocks --> Risk-Off
Credit Spread Z-Score (HYG/LQD):
Positive --> High yield outperforming --> Investors seeking yield
Negative --> Flight to quality --> Credit concerns
Oil/Gold Z-Score:
Positive --> Oil outperforming --> Economic optimism
Negative --> Gold outperforming --> Defensive positioning
Volatility Spread (VIX/MOVE):
Positive --> Equity vol falling relative to bond vol --> Risk stabilizing
Negative --> Equity vol rising --> Caution / Risk-Off
Composite Index:
> +1 --> Strong Risk Appetite
< -1 --> Strong Risk Aversion
Between -1 and +1 --> Neutral regime
Thank you for using the Cross-Asset Risk Appetite Index by CWRP!
I'm open to all critiques and discussion around macro-finance and hope this model adds clarity to your decision-making.
نص برمجي محمي
تم نشر هذا النص البرمجي كمصدر مغلق. ومع ذلك، يمكنك استخدامه بحرية ودون أي قيود - تعرف على المزيد هنا.
إخلاء المسؤولية
لا يُقصد بالمعلومات والمنشورات أن تكون، أو تشكل، أي نصيحة مالية أو استثمارية أو تجارية أو أنواع أخرى من النصائح أو التوصيات المقدمة أو المعتمدة من TradingView. اقرأ المزيد في شروط الاستخدام.